US Dollar (DXY) Price, Chart, and Analysis
- US inflation in line with market forecasts.
- Friday’s US NFPs will give a clearer picture of the US labor market.
The latest US inflation data met expectations and caused barely a ripple in the market with both the y/y and m/m data inline.
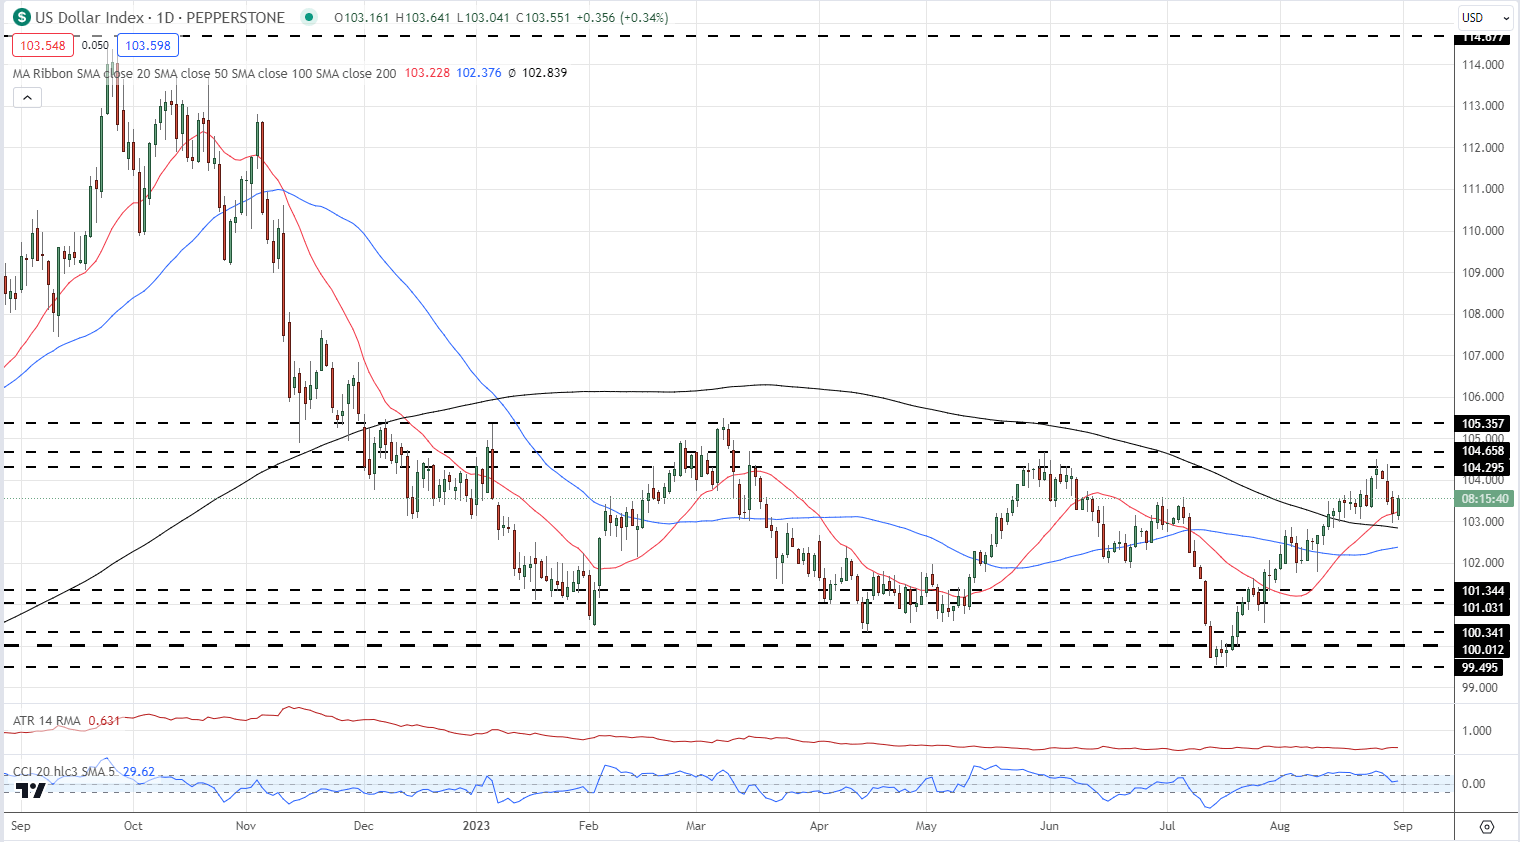
The US dollar moved a handful of ticks higher to 103.50, while the 2-year and 10-year US Treasury yields barely moved at 4.87% and 4.10% respectively. The US dollar continues to range trade and sits just above a cluster of simple moving averages. Initial resistance comes in at 104.295, while the 200-day sma provides near-term support at 102.84 ahead of the 50-day sma at 102.38.
US Dollar (DXY) Daily Price Chart – August 25, 2023

Recommended by Nick Cawley
Building Confidence in Trading
The final piece of this week’s data puzzle is released tomorrow at 13:30 UK. The US Jobs Report (NFP) is a closely watched barometer of the labor market and tomorrow’s release will be in particular focus after the raft of weak jobs numbers already reported this week. Tuesday’s JOLTs numbers were particularly weak…

…Wednesday’s ADP report missed an already lowly target…

…while the latest weekly jobless claims rose.

The latest market forecast is for the payrolls report to show that 170k new jobs were created in August, down from the downwardly revised 187k seen in July.
For all market-moving data releases and economic events see the real-time DailyFX calendar
Recommended by Nick Cawley
Trading Forex News: The Strategy
Chart via TradingView
What is your view on the US Dollar – bullish or bearish?? You can let us know via the form at the end of this piece or you can contact the author via Twitter @nickcawley1.


 آموزش مجازی مدیریت عالی و حرفه ای کسب و کار DBA


ارسال نظر شما
مجموع نظرات : 0 در انتظار بررسی : 0 انتشار یافته : ۰