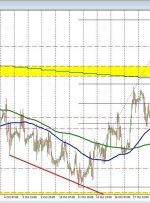
100-Day MA Provides Support to WTI but Will it Last?

WTI OIL PRICE, CHARTS AND ANALYSIS: WTI Struggling to Hold the High Ground Thanks in Part to a Resurgent US Dollar. Middle East Conflict to Remain a Critical Driver as it Continues to Underpin Oil Prices. EIA Inventories Rose Once More According to the Data. To Learn More About Price Action,Chart PatternsandMoving Averages, Check out

Rand Bulls Provoked by Key Support Break

RAND TALKING POINTS & ANALYSIS Geopolitics, Fed and Chinese factors at play. USD/ZAR rising wedge breakout now limited by support zone. USD/ZAR FUNDAMENTAL BACKDROP Macro-economic fundamentals underpin almost all markets in the global economy via growth, inflation and employment – Get you FREE guide now! Foundational Trading Knowledge Macro Fundamentals Recommended by Warren Venketas The

October low of 1.2037 will be the key support level – MUFG

Share: Economists at MUFG Bank analyze GBP outlook ahead of the BoE announcement on Thursday. Weak economic activity The worsening economic data has been clear and will likely be clearly acknowledged by Governor Andrew Bailey in the press conference. We see this inevitable acknowledgement of weaker data and some evidence that the labour

Cluster Support in Play after Breakdown. More Pain Ahead?

NASDAQ 100 OUTLOOK: Nasdaq 100 breaks down, falling to its lowest level since late May after breaching a key floor For sentiment to improve, cluster support in the 14,150/13,930 range must hold at all costs This article analyzes the key technical levels worth watching on the NDX in the coming days. Trade Smarter – Sign

GBP/USD Bounded by Fibonacci Support & Trendline Resistance

GBP/USD OUTLOOK: GBP/USD has been trending lower over the past three months or so After recent price action, cable appears compressed between trendline resistance and Fibonacci support This article presents important technical levels worth watching in the coming days Trade Smarter – Sign up for the DailyFX Newsletter Receive timely and compelling market commentary from

Hang Seng Index (HSI) Rallies on China Stimulus While AUD Finds Support on CPI Data

Hang Seng Index, China, HSI, PBOC, AUD/USD, AU CPI, Crude Oil – Talking Points Chinese bourses have been underpinned today by policy annoucements Australian 3Q CPI reaccelerated, lifting the prospect of an RBA rate hike The Hang Seng index rallied but some technical hurdles lie ahead Recommended by Daniel McCarthy Traits of Successful Traders Hong

CAD/CHF’s Potential Range Support Bounce

CAD/CHF is about to hit a major support zone! Can the pair bounce despite its uber-bearish downswing? The daily chart may provide some clues: CAD/CHF Daily Forex Chart by TradingView As you can see, back in late September CAD/CHF got rejected at the .6825 area that also happened to line up with a key area

Fractal Support and Resistance MT5 Indicator

In the fast-paced world of financial markets, traders are constantly seeking an edge. One tool that has gained significant attention in recent years is the Fractal Support and Resistance MT5 Indicator. This powerful technical analysis tool can provide invaluable insights into market trends, helping traders make more informed decisions. In this article, we will delve