Prior +10.6% New yuan loans ¥2.31 trillion vs ¥2.50 trillion expected Prior ¥1.36 trillion That’s a notable jump in new loans, even if it comes in lower than estimated. Broad money growth continues to ease further and will be something that Beijing has to be mindful about as the economy slows going into next year.

China’s run of low consumer inflation continues. And PPI continues to deflate y/y. The m/m PPI was +0.4%, rising oil a factor pushing it higher. Of more interest will be the trade data due some time around 0300 GMT (11pm US Eastern time). The release time is flexible. This article was written by Eamonn Sheridan

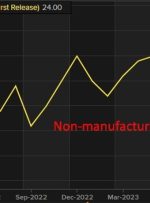
Reuters Tankan is a monthly survey that seeks to track the Bank of Japan’s tankan quarterly survey Japan manufacturers index +4 in October, unchanged from September Non-manufacturers index +24 in October vs +23 in September Manufacturers January index seen at +5, non-manufacturers +20 The survey covered familiar ground: prospect of higher U.S. interest rates has

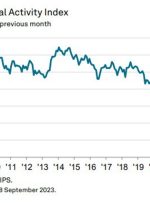
The downturn in September is led by a slump in house building as output also saw its steepest decline since May 2020. Adding to that, new orders also suffered its fastest pace of decline in over three years. S&P Global notes that: “Output levels declined across the UK construction sector for the first time in


