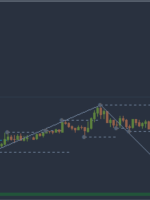
Today I present you an overview of trades made using the Owl strategy – smart levels for the EURUSD, GBPUSD and AUDUSD currency pairs for the week from October 23 to 27, 2023. For convenience and timely receipt of signals I use the Owl Smart Levels Indicator. The main trading timeframe is M15, while the H1 and H4
Market Cycles is a unique proprietary indicator that uses a neural network to determine the current market phase. For training, the neural network uses cyclic (reversal) patterns. Currency markets tend to cycle from bearish to bullish periods and back again. In this product, we combined patterns from four timeframes (M5, M15, M30, H1), which allowed us
Do you feel confused when you look at your trading screen, seeing prices go up and down without understanding why? It’s like trying to read a language you don’t know – frustrating and often doesn’t work.In your quest to understand price movements, you might have added a lot of indicators to your charts, making it
University of Michigan Consumer Sentiment Prelim was 63.0 Prior was 68.1 Details: Current conditions 70.6 vs 66.7 prelim (71.4 prior) Expectations 59.3 vs 60.7 prelim (66.0 prior) 1-year inflation 4.2% vs 3.8% prelim (3.2% prior) 5-10 year inflation 3.0% vs 3.0% prelim (2.8% prior) The Fed might be concerned about that bump in inflation expectations
Geopolitical and economic news flow stayed elevated this week, with both good and bad developments keeping price action mostly in a range. The War premium faded a bit early on as major escalation from Israel was pushed back through Thursday, and traders still had plenty to worry about with global growth, inflation and interest rate
The Aussie dollar took the top spot this week, closely followed by the Japanese yen, both likely bid higher after strong inflation updates hit the wires from their respective countries. And unfortunately for Loonie bulls, the Canadian dollar was the biggest loser, likely driven lower by falling oil prices and net negative commentary from the
EUR/USD: Awaiting the Pair at 1.0200? ● Having started the past week on a positive note, EUR/USD approached a significant support/resistance level at the 1.0700 zone on Tuesday, October 24, before reversing and sharply declining. According to several analysts, the correction of the DXY Dollar Index that began on October 3rd, which correspondingly drove EUR/USD
A popular trading expression is “the trend is your friend.” This expression has stood the test of time because trends are critically important to any trading plan. Forex trendlines can be seen in almost any charting analysis due to its usefulness and simplicity. This article provides traders with an in-depth guide on what trendlines are, how to draw
The Multistrategy Balance Analyzer has been meticulously designed to empower algorithmic traders. It provides a platform to visualize and test trading strategies, allowing them to closely monitor, during the optimization process, the performance of individual strategies—be it by magic numbers or symbols. This is instrumental in gaining insights into the precise dynamics of each strategy