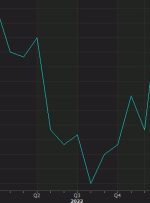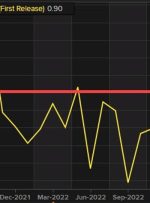
US construction spending US construction spending for July % versus 0.5% expected total construction spending $1,972.6 billion versus $1,938.4 billion last month Construction spending year on year +5.5% vs +3.5% prior private construction +1.0% vs +0.5% prior residential construction +1.4% vs +0.9% prior Residential construction is down 5.5% y/y but that should rebound in the

Information on these pages contains forward-looking statements that involve risks and uncertainties. Markets and instruments profiled on this page are for informational purposes only and should not in any way come across as a recommendation to buy or sell in these assets. You should do your own thorough research before making any

US pending home sales has back to back gains Prior month 0.3% revised to 0.4% Pending home sales for July 0.9% versus -0.6% estimate Pending home sales index 77.6 vs 76.8 last month. The Pending Home Sales Index (PHS), a leading indicator of housing activity, measures housing contract activity, and is based on signed real

Trade balance data from Japan for July 2023, along with Machinery orders for June. exports fell for the first time in 29 months Exports to: China -13.4% y/y the US +13.5% y/y the EU +12.4% y/y I think you can see the problem, right? China’s economic stumble out of COVID-zero reopening is impacting globally, not

Will this week’s Australian jobs numbers convince the Reserve Bank of Australia (RBA) to hike rates again? Here are major points you need to know if you’re planning on trading Australia’s labor market report this week: Event in Focus: Australia’s April Employment Data: Employment Change, Unemployment Rate When Will it Be Released: August 17, 2023


