Article by IG Senior Market Analyst Axel Rudolph Nikkei 225, FTSE 100, S&P 500 Prices and Analysis Initial Nikkei 225 Monday rally fizzles out The Nikkei 225 began the day on a positive footing and rose to the 55-day simple moving average (SMA) at 32,415.9 as Japan Q3 business sentiment climbed the highest in five
Written by Axel Rudolph, Senior Market Analyst at IG Recommended by IG Get Your Free Equities Forecast Nikkei 225 stabilizes as September draws to an end The Nikkei 225 stabilizes into month-end despite Japan consumer morale falling to a six-month low as better-than-expected preliminary industrial production and a positive close on Wall Street aided
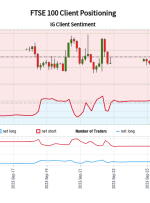
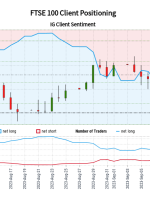
Number of traders net-short has decreased by 35.23% from last week. SYMBOL TRADING BIAS NET-LONG% NET-SHORT% CHANGE IN LONGS CHANGE IN SHORTS CHANGE IN OI FTSE 100 BEARISH 51.27% 48.73% 25.94% Daily 51.88% Weekly -21.61% Daily -35.23% Weekly -2.79% Daily -8.25% Weekly of clients are net long. of clients are net short. Change in Longs
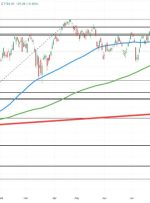
Written by Axel Rudolph, Senior Market Analyst at IG Recommended by IG Get Your Free Equities Forecast FTSE 100 stabilizes after slip The FTSE 100, having on Monday slipped through its 200-day simple moving average (SMA) at 7,649 on the back of global risk-off sentiment, now stabilizes above this week’s low at 7,581 as the
The major European indices are ending mostly lower. The one exception is the UK FTSE 100 which eked out a small gain. A snapshot of the closing levels shows: German DAX fell -5.06 points or -0.03% at 15566.81 Frances CAC fell -23.49 points or -0.33% at 7190.42 UK’s FTSE 100 rose 13.43 points or 0.17%
Article by IG Senior Market Analyst Axel Rudolph FTSE 100, DAX 40, S&P 500 Analysis and Charts FTSE 100 rises as UK inflation diminishes The FTSE 100 bounced off its 200-day simple moving average (SMA) at 7,643 as UK consumer price inflation (CPI) for August came in at a better-than-expected 6.7% year-on-year (YoY) versus an
Number of traders net-short has increased by 40.38% from last week. SYMBOL TRADING BIAS NET-LONG% NET-SHORT% CHANGE IN LONGS CHANGE IN SHORTS CHANGE IN OI FTSE 100 BULLISH 46.27% 53.73% -12.56% Daily -26.97% Weekly 21.99% Daily 40.38% Weekly 3.14% Daily -1.60% Weekly of clients are net long. of clients are net short. Change in Longs