EUR/USD: Midpoint of the ‘Dull Period’ ● n the next part of the review, we will discuss how one crypto analyst used the term “dull period” in relation to the BTC/USD chart. The EUR/USD chart looks even more uneventful. While from 20 August until today, the pair fluctuated within the 1.1000-1.1200 range, last week it

EUR/USD: Storms and Tempests on September 18, 19, and 20 ● The past week can be divided into two parts – from September 9 to 11, and from the 12th to the 13th. Initially, the dollar strengthened, then it lost ground. The trend shift occurred after data released on Wednesday, September 11, indicated a

EUR/USD: Markets Await ECB and Fed Meetings ● If the US economy is growing, investors buy up dollars to invest in the US stock market. As a result, the DXY Dollar Index rises. But as soon as the dark shadow of an impending recession falls over the rosy picture, the countdown begins. Moreover, an economic

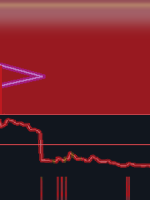
Hello Traders, we had a trade on EURNZD on H1 time-frame that today 29 November 23 the market already moved +1500 Points! In this trade we had first a red triangle of the Italo Triangle Indicator showing that the market is going to trend. The confirmation was the neon red line of Italo Volume Indicator above the

RBNZ Governor Orr press conference following the policy decision: RBNZ leaves cash rate unchanged at 5.5%, as expected RBNZ Policy Meeting: NZD/USD surges Via Westpac: The risk of an RBNZ rate hike “is real” From Orr: Meeting with new PM was highly constructive We’ve been adamant on holding rates through next year Projection shows upward

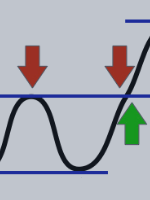
Support occurs when falling prices stop, change direction, and begin to rise. Support is often viewed as a “floor” which is supporting, or holding up, prices. Resistance is a price level where rising prices stop, change direction, and begin to fall. Resistance is often viewed as a “ceiling” keeping prices from rising higher. If price

Evaluating Trading Strategy Performance Metrics: A Comprehensive Overview When assessing the effectiveness of trading strategies, a set of key performance metrics provides valuable insights into their profitability, risk management, and overall robustness. The Profit Factor is a fundamental metric that compares the gross profits to gross losses. For instance, if a strategy has a Profit

Forex traders utilize Fibonacci retracements to aid in identifying possible key levels of support and resistance. These levels are used as guidelines for traders looking to enter or exit the market along with appropriate risk management techniques. HOW TO CREATE A FIBONACCI RETRACEMENT ON A FOREX PAIR Before delving deeper into practical examples, traders need to have a

EUR/USD: Day of Thanksgiving and Week of Contradictions ● Reminder that the American currency came under significant pressure on November 14 following the release of the Consumer Price Index (CPI) report in the USA. In October, the Consumer Price Index (CPI) decreased from 0.4% to 0% (m/m), and on an annual basis, it dropped from


