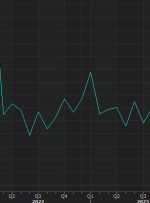
Prior was -6.4K Full time +32.2K vs +1.7K prior Part time +7.8K vs -8.1K prior Participation rate 65.5% vs 65.6% prior Average hourly wages permanent employees +5.2% y/y vs +4.7% expected (+5.0% prior) Total average hourly wages 4.9% y/y vs 5.0% prior Unemployment rate 5.5% vs 5.5% prior Participation rate 61.9% vs 62.0% prior Involuntary

> US July consumer credit outstanding +10.4B vs +16.0B expected US consumer credit data for July Adam Button Friday, 08/09/2023 | 19:02 GMT-0 08/09/2023 | 19:02 GMT-0 Prior was +17.85B (revised to +14.02B) ADVERTISEMENT – CONTINUE READING BELOW Tags ADVERTISEMENT – CONTINUE READING BELOW Most Popular ADVERTISEMENT – CONTINUE READING BELOW ADVERTISEMENT – CONTINUE READING
China’s consumer-price index and producer-price index from the National Bureau of Statistics. higher services prices (prices of air tickets, tourism and accommodation rose over the summer holiday season) dragged CPI up from its negative return in the previous month neverthelss CPI came in lower than the surveyed consensus of expectations from economists food prices fell

High risk warning: Foreign exchange trading carries a high level of risk that may not be suitable for all investors. Leverage creates additional risk and loss exposure. Before you decide to trade foreign exchange, carefully consider your investment objectives, experience level, and risk tolerance. You could lose some or all your initial investment; do not
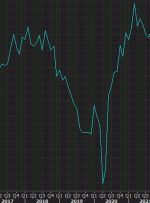
ISM manufacturing Prior report 46.4 Prices paid 48.4 vs 43.9 expected. Last month 42.6 Employment 48.5 vs 44.2 expected. Last month 44.4 New orders 46.8 vs 47.3 prior Manufacturing has been in a recession for some time but there are some green shoots. I suspect this survey is going to be a mess for the
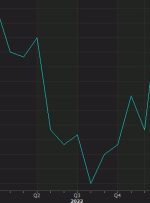
US construction spending US construction spending for July % versus 0.5% expected total construction spending $1,972.6 billion versus $1,938.4 billion last month Construction spending year on year +5.5% vs +3.5% prior private construction +1.0% vs +0.5% prior residential construction +1.4% vs +0.9% prior Residential construction is down 5.5% y/y but that should rebound in the

Wall Street took comfort from several downside surprises in US macro data overnight, with the data taming some rate hike bets and saw US Treasury yields decline. The US two-year yields were down 11 basis-point (bp), reversing all of last week’s gains, while the 10-year yields were down 8 bp to deliver a two-week low.
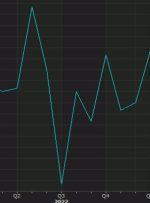
Prior was +0.2% June advance reading was 0.0% Ex autos -0.8% vs +0.3% expected (prior was 0.0%, revised to -0.3%) July advance reading +0.4% June year-over-year sales -0.6% vs +0.5% prior Sales ex autos y/y -3.3% Vehicle sales are the only thing holding up sales and I wonder how much of that is delayed orders


