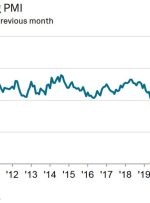
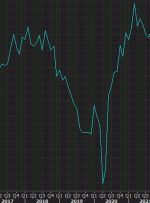
US August ISM manufacturing PMI 47.6 vs 47.0 expected

ISM manufacturing Prior report 46.4 Prices paid 48.4 vs 43.9 expected. Last month 42.6 Employment 48.5 vs 44.2 expected. Last month 44.4 New orders 46.8 vs 47.3 prior Manufacturing has been in a recession for some time but there are some green shoots. I suspect this survey is going to be a mess for the

Bitcoin stumbles 2%, nears the August lows. What’s next

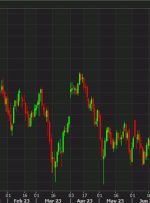
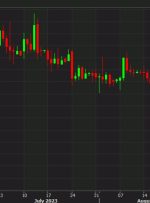
BTC daily It’s been a volatile week for bitcoin and it’s ending on a poor note. Bitcoin is down $570 or 2.2$ to $25,445. That’s just above the August low of $25,350. Bitcoin popped on Tuesday after the SEC lost a court case brought by Grayscale and its improper dismissal of a spot ETF. That

How will the US Dollar react to August NFP?

Share: US Nonfarm Payrolls are expected to increase by 170K in August, slowing from the 187K reported in July. The headline NFP and Average Hourly Earnings could impact the Fed’s future policy. The Unemployment Rate in the United States is seen steady at 3.5% in August. Traders scale back the odds of a

Market Update – August 31 – Markets sustain the “Bad News Is Good News” stance

Asian stock markets traded mixed overnight, with mainland China bourses underperforming. Chinese manufacturing contracted in August for a 5th straight month, while Chinese property stocks fell after Country Garden, once the country’s largest developer by sales, reported record losses and China Vanke cancelled a share placement. China’s property sector is dealing with a renewed liquidity

UTM: Troubleshooting Guide – Other – 31 August 2023

This is part of the larger  UTM Manager Guide – Other – 30 January 2023 – Traders’ Blogs (mql5.com) If you are experiencing any bugs or problems with the UTM Manager, please follow the steps below to assist the developer in troubleshooting the issue: Enable Debugging Logs: Launch the the UTM Manager. Go to the

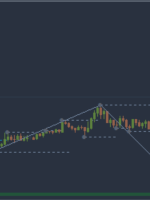
Bullish rectangle pattern indicator – Trading Ideas – 27 August 2023

Bullish rectangle pattern example in video This video shows how I use bullish rectangle pattern for my trading technical analysis. Bullish rectangle pattern is used to mark consolidation candles and place price alert. This way trader is notified when bullish rectangle pattern is broken and price action is created. I like bullish rectangle chart pattern to get edge

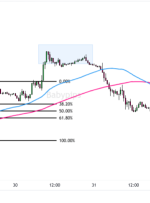
Bearish rectangle pattern indicator – Trading Systems – 27 August 2023

Bearish rectangle pattern video and example In this post I focus to show example for bearish rectangle pattern in my trading strategy based on price action and supply demand rectangles. With this technical analysis indicator I can do a lot of trading and charting very quickly and easily. Bearish rectangle chart pattern is used to place

Detailed Installation Instructions for Boring Pips EA – Trading Strategies – 30 August 2023

Boring Pips is an expert advisor that combines advanced artificial intelligence algorithms with classic trading strategies involving momentum, support, and resistance levels. Despite its advanced technology, simplicity and user-friendliness are maintained. Please find the links attached for more details about the Boring Pips EA: Unlike other trading systems, Boring Pips does not overwhelm users with

Market Update – August 30 –  Data bring Joy, for now?

Weaker than expected consumer confidence and JOLTS numbers helped diminish Fed rate hike risks which in turn underpinned strong gains in Treasuries, Wall Street & the Asian stock market today as the markets clawed back some of the hefty losses in August also on speculation that the Fed is nearing the end of the tightening