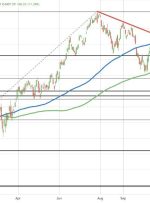
S&P surges above 100-Day MA, Signals bullish momentum

S&P indexes moving above its 100 day moving average The S&P index is currently trading near session highs, up 60.44 points or 1.39% at 4407.92, and in the process has broken above its 100-day moving average of 4402.47 (see the blue line in the chart above). The last time it traded above this moving average

WTI Remains Vulnerable Below the 100-Day MA

OIL PRICE FORECAST: Most Read: What is OPEC and What is Their Role in Global Markets? Oil prices are up around 1.3% at the time of writing as Saudi Arabia and Russia reiterate commitment to supply cuts. The two OPEC members confirmed their commitment to extra voluntary oil supply cuts to the end of 2023.

100-Day MA Provides Support to WTI but Will it Last?

WTI OIL PRICE, CHARTS AND ANALYSIS: WTI Struggling to Hold the High Ground Thanks in Part to a Resurgent US Dollar. Middle East Conflict to Remain a Critical Driver as it Continues to Underpin Oil Prices. EIA Inventories Rose Once More According to the Data. To Learn More About Price Action,Chart PatternsandMoving Averages, Check out

NZD/JPY falls below the 100-day SMA, towards 87.30

Share: NZD/USD saw 0.30% losses declining near 87.30 . The cross tallies a four-day losing streak and will close a 0.80% losing week. For the first time since April, the pair trades below the 20 and 100-day SMA. In Friday’s session, the NZD/JPY continued facing selling pressure, seeing losses for a fourth consecutive day.

Bears threatens the 100-day SMA amid USD strength

Share: XAG/USD peaked at a daily high of $24.80 then settled near the $24.15 area. US NFPs and PMI figures from August beat expectations. Still, wages decelerated, and Unemployment rose. The USD strength drove the grey metal downwards. At the end of the week, the XAG/USD closed with losses but managed to hold some

Selling Pressure Remains Below the 100-Day MA

EUR/USD PRICE FORECAST: Your Free Guide to the EURO for the Rest of Q3 Below Recommended by Zain Vawda Get Your Free EUR Forecast READ MORE: USD/JPY, EUR/JPY Update: A Temporary Pause Before Bullish Continuation? EUR/USD put in impressive gains early in the US session before a return of Dollar strength saw the pair surrender

EUR/GBP fails to surpass the 100-day SMA amid GBP’s

Share: EUR/GBP retreated near 0.8630 after being rejected by the 100-day SMA at 0.8670. Q2 GDP data from the UK avoided stagnation, surpassing market expectations. Higher British yields help the Pound trade stronger against most of its rivals. In Friday’s session, the GBP traded with gains agains most of its rivals as the

Bulls rejected by the 100-day SMA following US NFPs

Share: USD/CAD reversed its course during the American session and got rejected by the 100-day SMA, falling to near 1.3335. NFPs showed that job creation in July cooled down while wages increased. Canada reported soft labour market and economic activity figures. On Friday, the USD/CAD cleared daily gains and fell into negative territory

Dollar Index (DXY) Eyes Acceptance Above 100-Day MA, USD/CHF Ticks Higher

DOLLAR INDEX, USD/CHF PRICE, CHARTS AND ANALYSIS: Recommended by Zain Vawda Get Your Free USD Forecast Most Read: US Dollar Forecast: ‘Soft Landing’ Narrative Gains Traction Post FOMC US DOLLAR, FITCH RATINGS DOWNGRADE The US Dollar and Dollar Index (DXY) faced a slight pullback as yesterday’s US session began winding down as Fitch Ratings Agency