

Article by IG Senior Market Analyst Axel Rudolph
Ftse 100, Nasdaq 100, Dow Jones Analysis and Charts
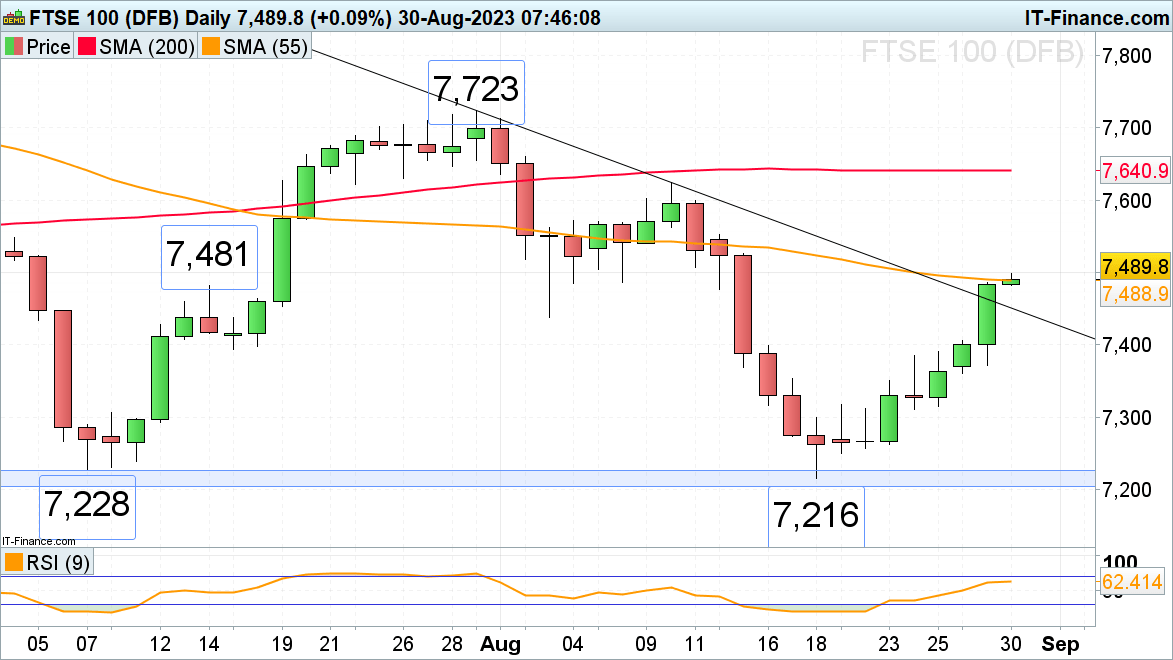
FTSE 100 has broken through its downtrend line
The FTSE 100 has now broken through its July-to-August downtrend line, tracking Wall Street higher following weak US job opening data which shows that the US economy may be cooling, fuelling hopes that the Fed might stop raising rates. The 55-day simple moving average (SMA) at 7,489 is currently being tested with the minor psychological 7,500 mark remaining in sight ahead of the 10 August high at 7,624.
Minor support can now be found along the breached July-to-August downtrend line at 7,450 ahead of the May, June, and early August lows at 7,437 to 7,401.
FTSE 100 Daily Chart
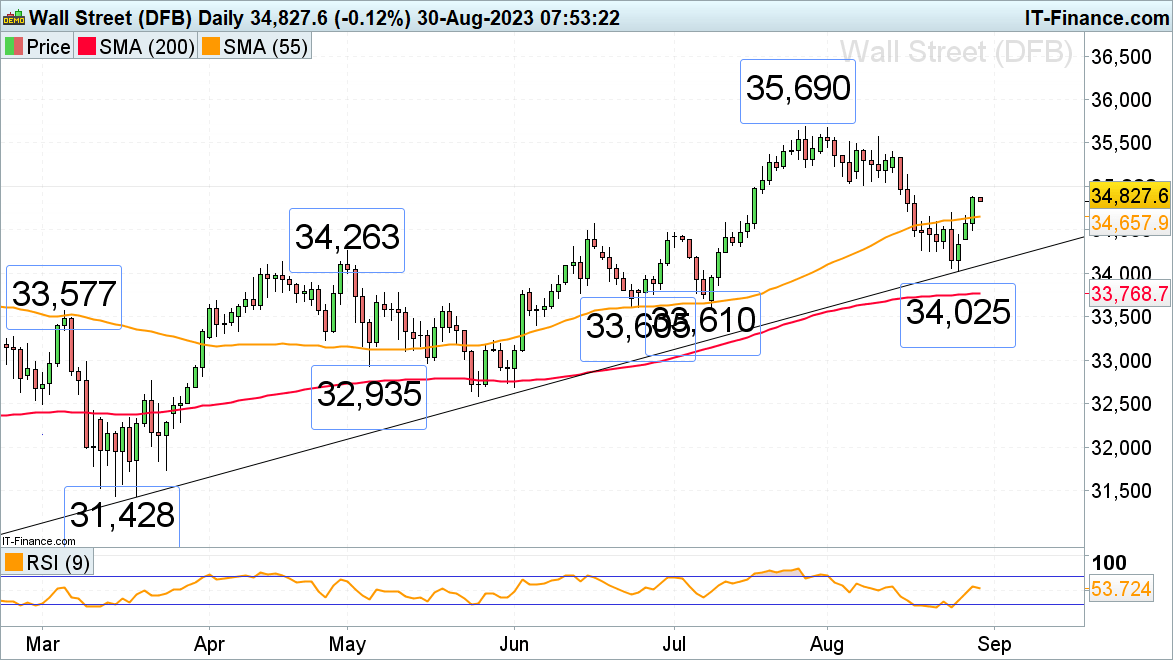
The Dow Jones Industrial Average continues its long-term uptrend
The Dow Jones Industrial Average’s rise and daily chart close above last week’s high at 34,696 points towards the August corrective phase lower having ended with the July peak at 35,690 being back in sight. The first upside target is the minor psychological 35,000 region.
Slips should find support between last week’s high and the 55-day simple moving average (SMA) at 34,696 to 34,658. Key support remains to be seen between the October-to-August uptrend line at 34,100 and the late June low at 33,605. While it underpins, the bullish long-term trend remains intact.
Dow Jones Daily Chart
Recommended by IG
Traits of Successful Traders
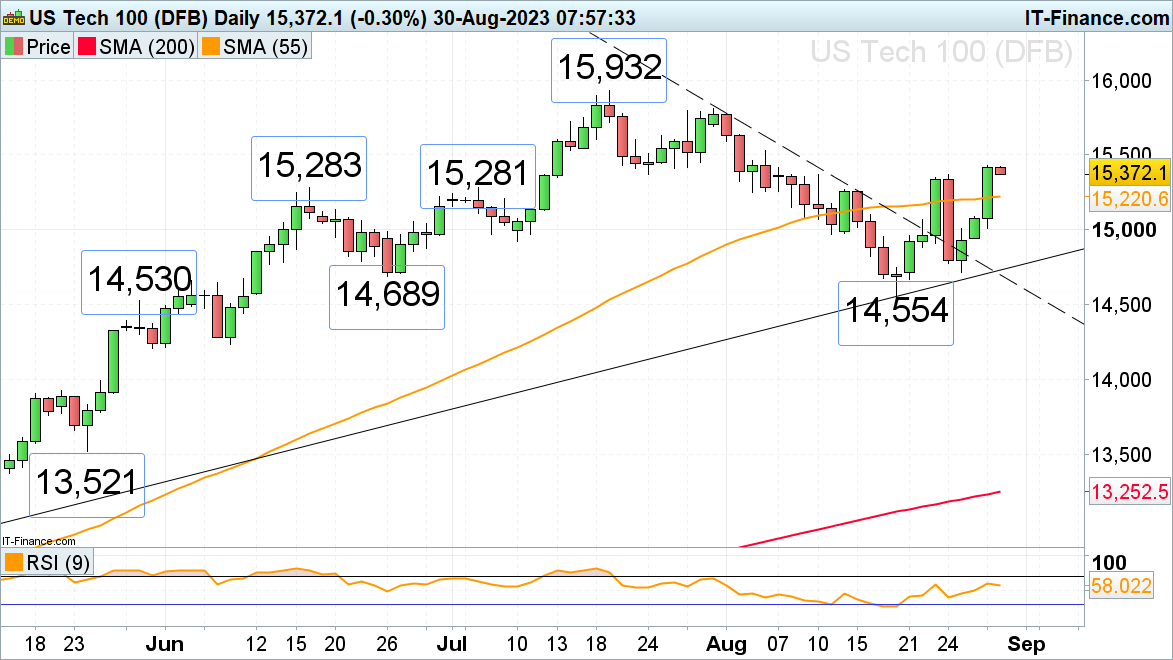
Nasdaq 100 confirms bottoming formation with long-term uptrend to continue
The Nasdaq 100’s summer correction has most likely run its course with the index now having risen and closed above last week’s high at 15,369 on Tuesday. Therefore, while the August trough at 14,554 underpins, the July peak at 15,932 will remain in focus.
Minor support below last week’s high at 15,369 comes in along the 55-day simple moving average (SMA) at 15,221. Minor support below the 55-day SMA sits between last Tuesday’s high at 15,066 and the minor psychological 15,000 mark.
Nasdaq 100 Daily Chart
Recommended by IG
Top Trading Lessons

 آموزش مجازی مدیریت عالی و حرفه ای کسب و کار DBA


ارسال نظر شما
مجموع نظرات : 0 در انتظار بررسی : 0 انتشار یافته : 0