Article by IG Chief Market Analyst Chris Beauchamp
S&P 500, Nasdaq 100, CAC40 Prices, Analysis, and Charts
S&P 500 hits new 2023 high
The index has surged to a new high for the year, and its highest level since April 2022.The Fed decision last night gave space for the dollar to weaken and equities to rally, and the S&P 500 rallied off its lows to clear 4580. Further gains now target the March 2022 high at 4631, while beyond this January’s high at 4730 and then the record high at 4817 come into view.
While the price may look overextended in the short term, so far there is little sign of any substantive turn lower. For this to happen we would need a drop back below 4500, and then a move to the 4400 support level or the 50-day SMA might come into view.
S&P 500 Daily Chart
Recommended by IG
Traits of Successful Traders
Nasdaq 100 resumes its move higher
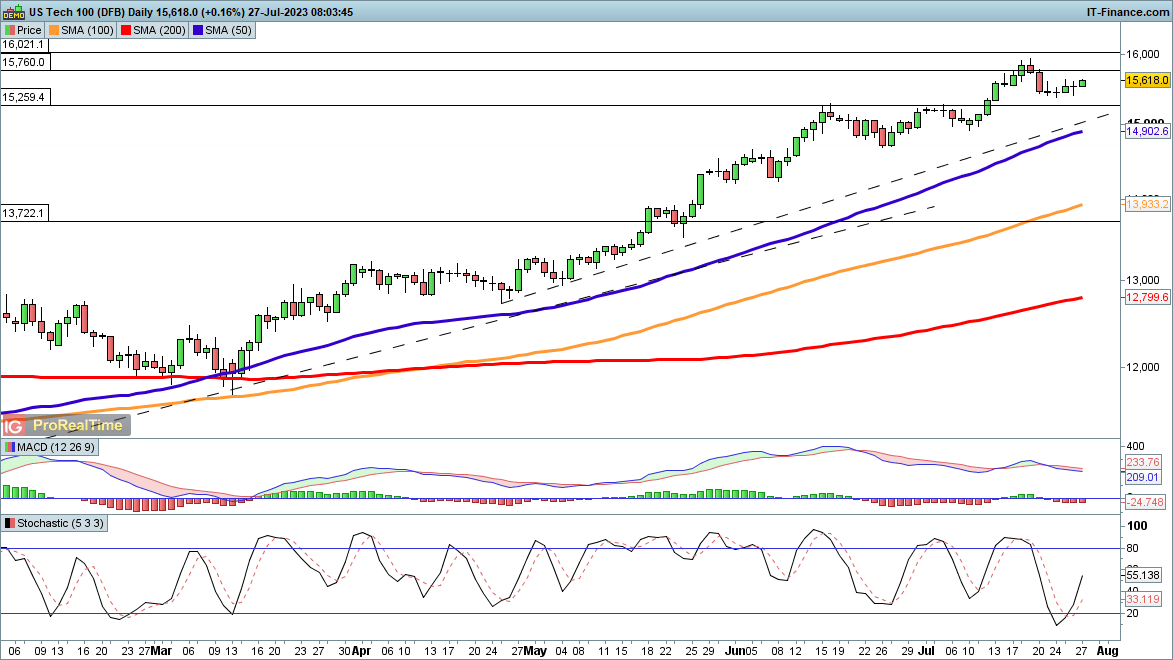
A similar picture prevails for the Nasdaq 100, although it remains below its recent highs for the time being. Last week’s high at 15,932 is the next target to watch, while beyond this, the mid-January high at 16,021 comes into view. After this, the final hurdle, for now, becomes the record highs of November and December around 16,630 (and November’s intraday record high of 16,769).
The index continues to defy all expectations of a turn lower, although more tech earnings will arrive over the next week. The most recent drop fizzled out after two days, which in itself should send a warning to sellers that there is still plenty of bulls willing to step in after the slightest weakness. The price remains solidly above the 50-day SMA, and for now, shows no inclination to head lower. Trendline support from the April low and then the 50-day SMA are close by in the event of a pullback.
Nasdaq 100 Daily Price

Recommended by IG
How to Trade FX with Your Stock Trading Strategy
CAC40 mixed ahead of ECB decision
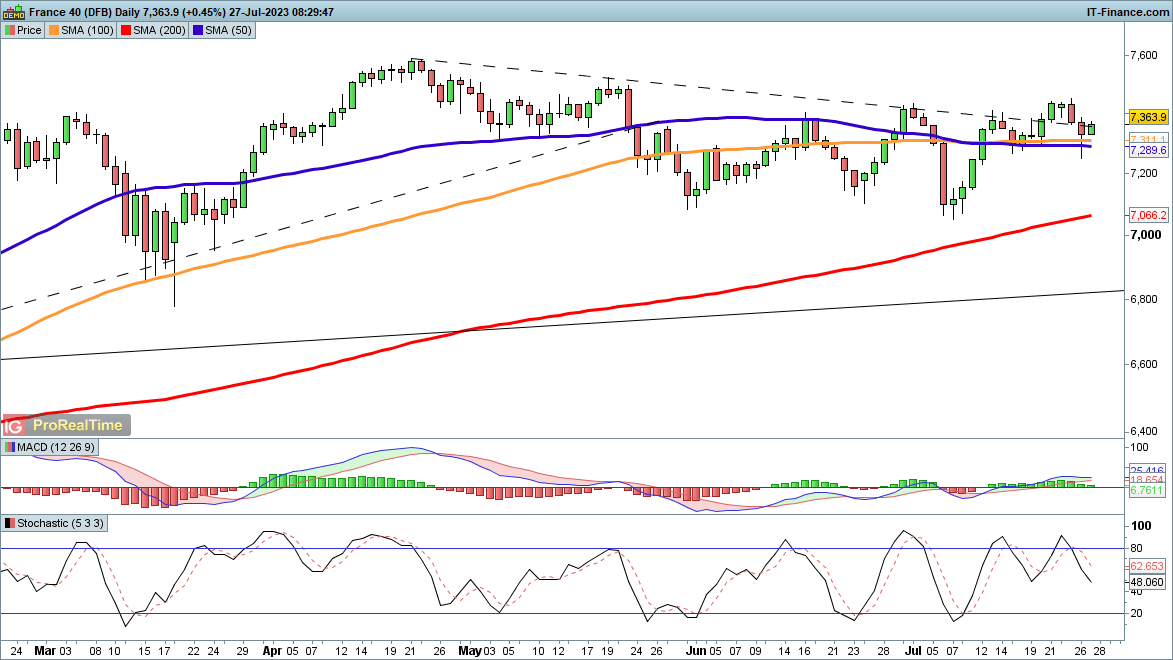
The index hit a two-week low yesterday, but rallied into the Fed decision and beyond.Unsurprisingly, some of that enthusiasm has ebbed as investors contemplate the ECB meeting today. The price has failed to hold its overnight highs and is struggling to hold above trendline resistance from the April high. Bears will want to see a close below 7290, which might come about from a more hawkish ECB meeting.
Alternately, more gains would come about through a move to 7450, with a close above this level reinforcing the bullish outlook. This would bring 7500 and then the April high at 7584 into play.
CAC40 Daily Price Chart


 آموزش مجازی مدیریت عالی و حرفه ای کسب و کار DBA


ارسال نظر شما
مجموع نظرات : 0 در انتظار بررسی : 0 انتشار یافته : ۰