Gold (XAU/USD) Analysis, Prices, and Charts
- US dollar weakness may be put on hold ahead of the Thanksgiving Holiday
- The technical set-up for gold looks positive.
Learn how to trade gold with our complimentary guide
Recommended by Nick Cawley
How to Trade Gold
DailyFX Economic Calendar
Tonight’s minutes of the November 1st FOMC meeting will shed some more light on the Fed’s thinking for the months ahead. While the markets have already decided that interest rates have peaked, and will be cut next year, Chair Powell remains reticent to say that the Fed has won its fight with inflation. Chair Powell continues to say that the US central bank will hike rates further if needed, while the market is saying that US interest rates will be cut by 100 basis points by the end of next year, with the first 25bp cut penciled in at the May 2024 meeting.
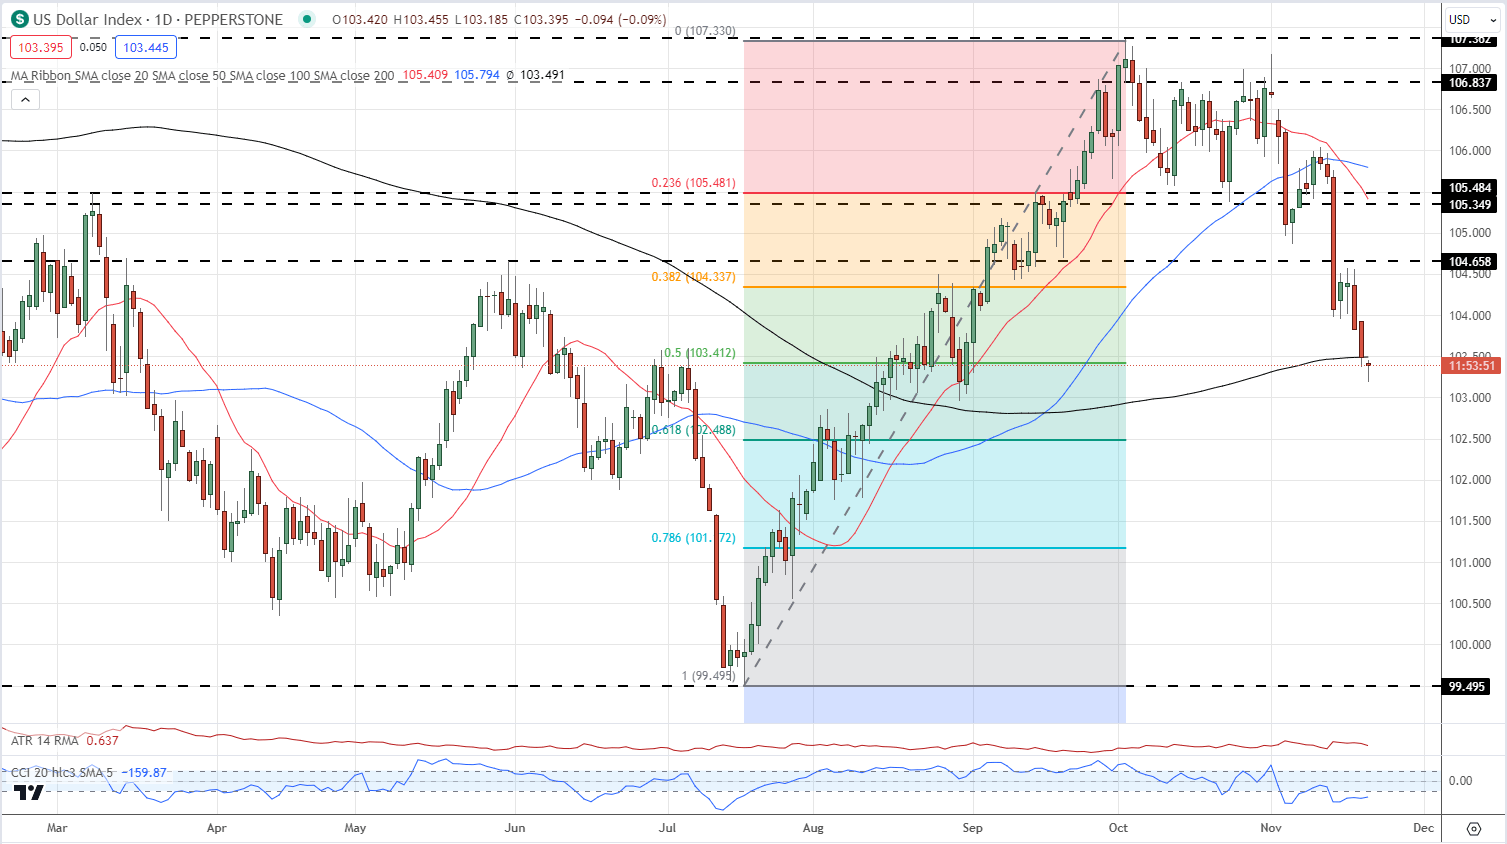
With the market now backing the view that rates are not going any higher, the US dollar has been moving lower. The US dollar index has shed four points since the beginning of November and broken through a number of layers of support with ease. If the DXY is unable to reclaim the 200-day simple moving average, further losses are likely.
US Dollar Index Daily Chart – November 21, 2023

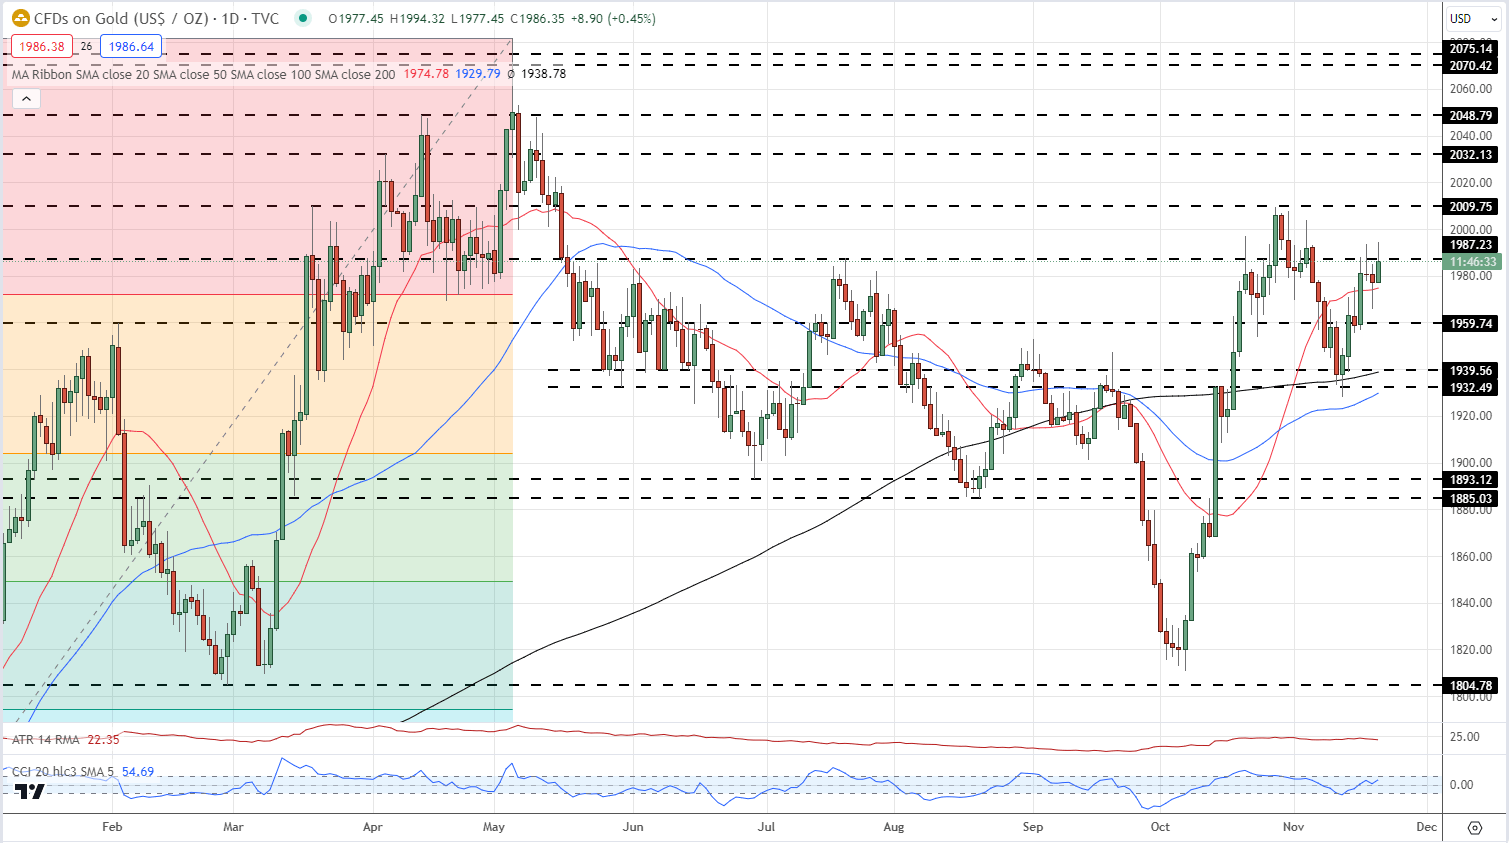
In contrast to the US dollar, the technical outlook for gold looks positive. After selling off over the last three weeks as markets turned risk-on, the precious metal is now looking at the US interest rate space and pushing higher. Gold is trading above all three moving averages and is back above the 23.6% Fibonacci retracement level at $1,972. The recent $2,009/oz. high is the next target for bulls. Support is seen at $1,972/oz. ahead of $1,960/oz.
Financial markets as a whole are expected to quieten down after Wednesday as the US celebrates Thanksgiving Day on Thursday before the annual Black Friday event. This liquidity drain will weigh on volatility going into the weekend.
Gold Daily Price Chart – November 21, 2023

Charts via TradingView
IG Retail Trader data show 59.19% of traders are net-long with the ratio of traders long to short at 1.45 to 1.Download the latest Gold Sentiment Report to see how daily and weekly changes affect price sentiment.
| Change in | Longs | Shorts | OI |
| Daily | -1% | 8% | 2% |
| Weekly | -10% | 12% | -2% |
What is your view on Gold – bullish or bearish?? You can let us know via the form at the end of this piece or you can contact the author via Twitter @nickcawley1.


 آموزش مجازی مدیریت عالی و حرفه ای کسب و کار DBA


ارسال نظر شما
مجموع نظرات : 0 در انتظار بررسی : 0 انتشار یافته : 0