

Crude Oil, WTI, Retail Trader Positioning, Technical Analysis – IGCS Commodities Update
- Crude oil prices aiming for 2nd weekly gain
- Retail traders continue to become bearish
- But, technical signals offer reversal signs
Recommended by Daniel Dubrovsky
Get Your Free Oil Forecast
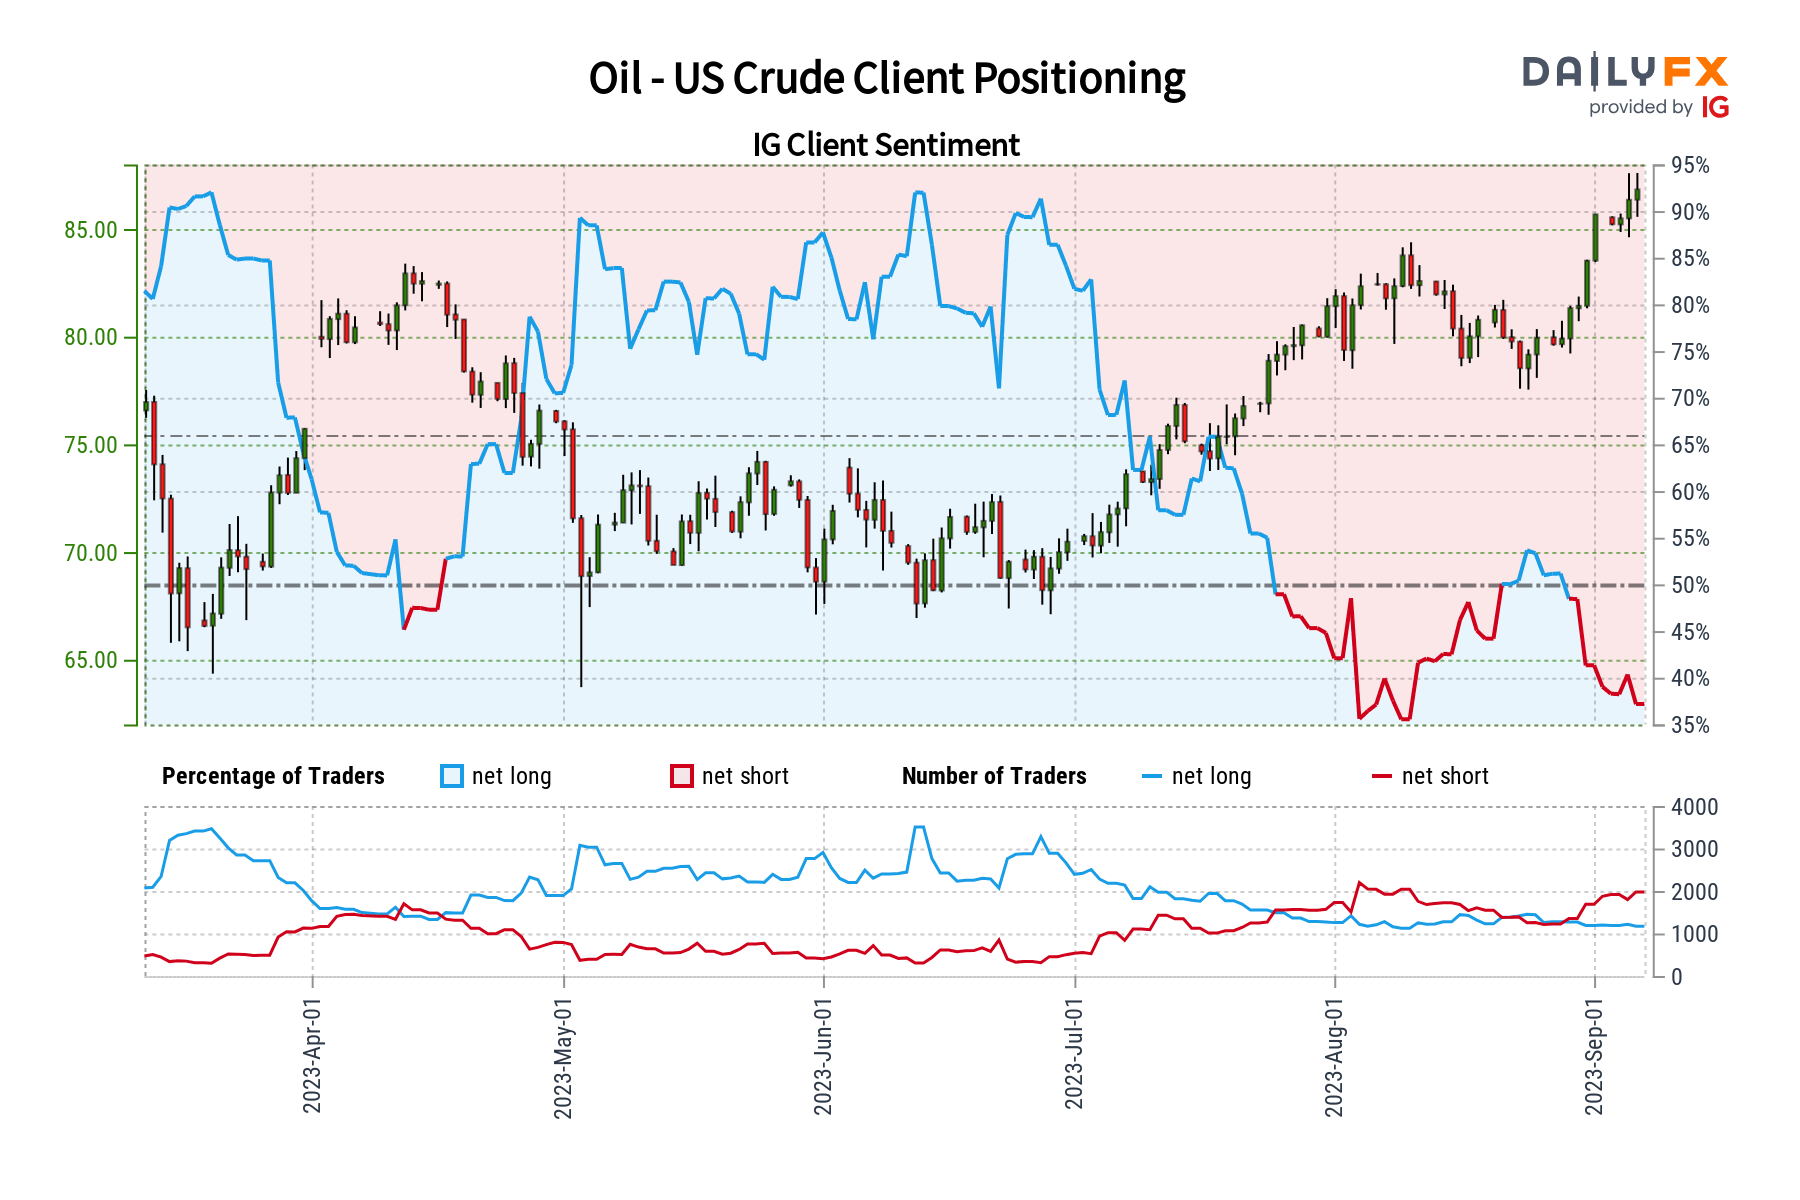
WTI crude oil prices are aiming for a second consecutive weekly gain so far. Strong gains since June meant that retail traders became increasingly bearish on the commodity. This can be seen by taking a look at IG Client Sentiment (IGCS), which frequently works as a contrarian indicator. With that in mind, could further gains be in store for oil?
Crude Oil Sentiment Outlook – Bullish
According to IGCS, about 39% of retail traders are net-long crude oil. With most of them being biased to the downside, this hints that prices may continue to rise down the road. Meanwhile, downside exposure has increased by 6.3% and 32.95% compared to yesterday and last week, respectively. With that in mind, the combination of overall positioning and recent changes offers a stronger bullish contrarian trading bias.
| Change in | Longs | Shorts | OI |
| Daily | -2% | 2% | 0% |
| Weekly | -5% | 28% | 13% |
On the daily chart below, there are a couple of preliminary warning signs that oil is looking increasingly toppy. For starters, a Bearish Harami candlestick pattern has emerged over the past 48 hours. While downside confirmation is lacking at this time, extending lower in the aftermath of this formation could increasingly point towards a reversal.
Meanwhile, negative RSI divergence shows that upside momentum is fading. That can also at times precede a turn lower. Immediate support is the 84.845 inflection point from August. A breakout below this exposes the 50-day Moving Average. Otherwise, near-term resistance is the 61.8% Fibonacci extension level of 88.75.
Recommended by Daniel Dubrovsky
How to Trade Oil
Crude Oil Daily Chart
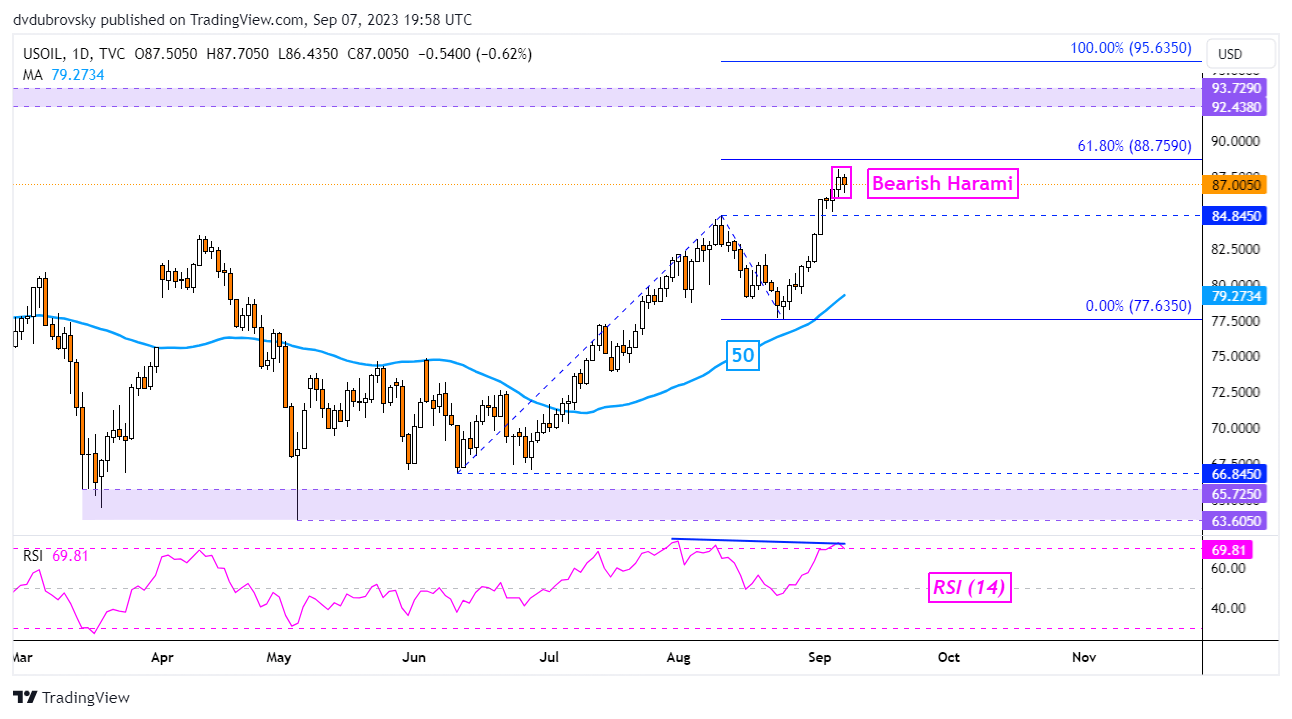
Chart Created in Trading View
— Written by Daniel Dubrovsky, Senior Strategist for DailyFX.com

 آموزش مجازی مدیریت عالی و حرفه ای کسب و کار DBA


ارسال نظر شما
مجموع نظرات : 0 در انتظار بررسی : 0 انتشار یافته : 0