

Article by IG Chief Market Analyst Chris Beauchamp
Nasdaq 100, Nikkei 225, S&P 500 Analysis and Charts
Nasdaq 100 losses resume
Losses accelerated on Wednesday, taking the index to its lowest level since early June. A move towards the lower bound of the channel appears likely, which would see the index head down to 14,250. A breakout to the downside then targets the 200-day SMA.
Wednesday’s drop negated the possible bullish view from earlier in the week, and it would take a rally back above 14,500 to indicate that a new attempt to halt the selling is underway.
Nasdaq 100 Daily Chart

Download our Q4 Equities Forecast for Free
Recommended by IG
Get Your Free Equities Forecast
Nikkei 225 stumbles
An attempt to continue the gains of Monday and Tuesday was beaten back on Wednesday, with the index dropping back to the 200-day SMA. Additional declines now target the low from Tuesday at 33,500, and then below this the September low at 33,270 comes into view.
It would need a close back above 31,300 to indicate that a new attempt to form a low is beginning.
Nikkei 225 Daily Chart

See our Q4 Top Trading Opportunities Below
Recommended by IG
Get Your Free Top Trading Opportunities Forecast
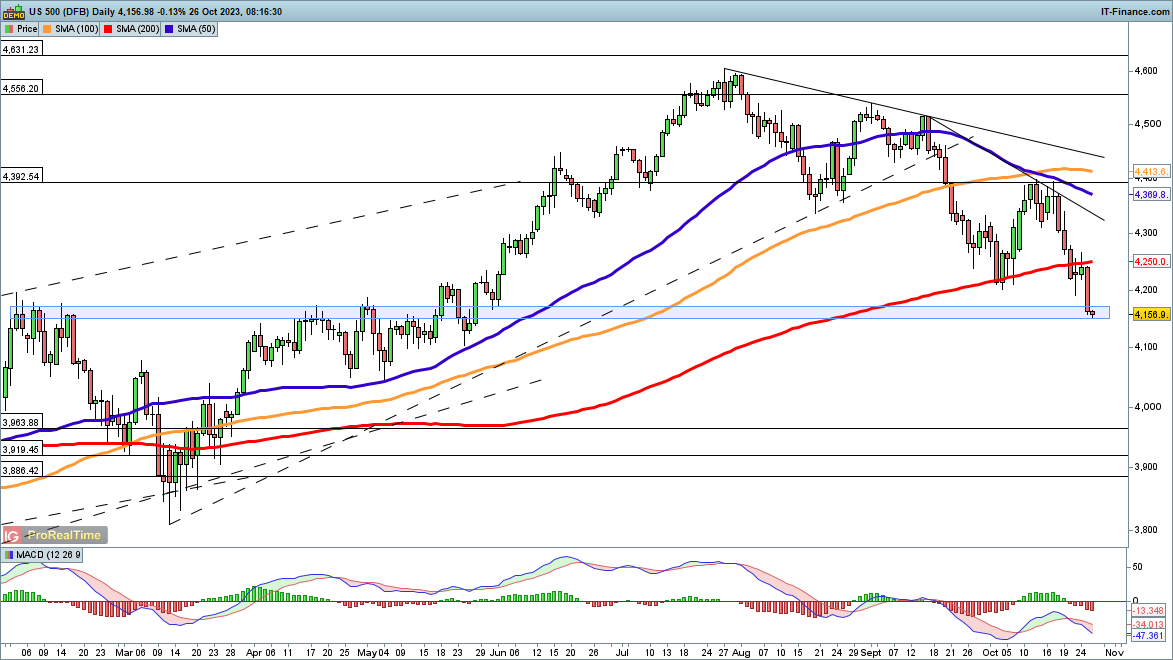
S&P 500 hits five-month low
The index resumed its fall on Wednesday, dropping to its lowest level in almost five months.The February highs around 4165 now seem to beckon as a downside target, followed up by the early March high at 4079.
Buyers will need a close back above the 200-day SMA to help suggest that a more bullish view prevails.
S&P 500 Daily Chart
See the Latest S&P 500 Sentiment
| Change in | Longs | Shorts | OI |
| Daily | 7% | -9% | 1% |
| Weekly | 29% | -23% | 5% |

 آموزش مجازی مدیریت عالی و حرفه ای کسب و کار DBA


ارسال نظر شما
مجموع نظرات : 0 در انتظار بررسی : 0 انتشار یافته : 0