

Article by IG Chief Market Analyst Chris Beauchamp
Nasdaq 100, S&P 500, Nikkei 225 Charts and Analysis
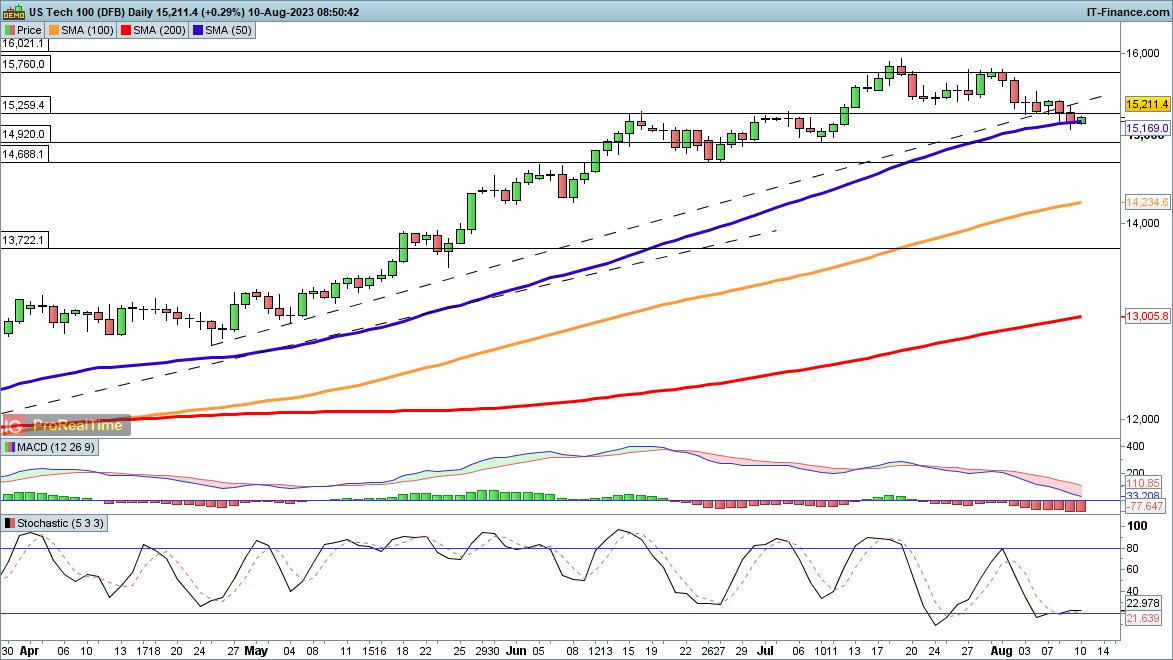
Nasdaq 100 back to 50-day SMA
The index has pushed steadily lower in August so far, continuing the weak theme from the end of July.It has managed to stabilise around the 50-day SMA for the time being, though additional declines would see the index had towards the early July low around 14,920, and then down to 14,688.
A more sustained rally would require a close back above 15,500, which would also see the price recover the trendline from late April.
Nasdaq100 Daily Price Chart
Recommended by IG
Traits of Successful Traders
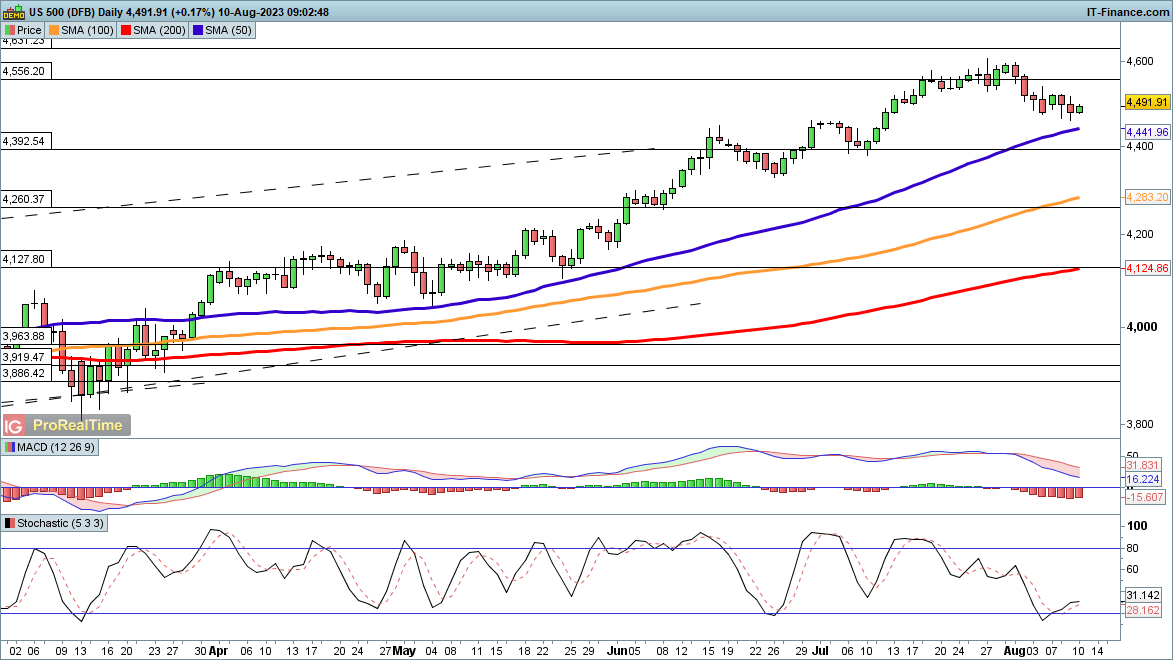
S&P 500 stabilises ahead of CPI
The modest pullback has yet to end definitively, though the index has edged higher in early trading.The index has yet to even test the 50-day SMA, so for now this is not a major retracement. Should US inflation this afternoon come in weaker than expected stocks could recover, and this could see the index move back above 4550 and establish a higher low.
Additional declines below the 50-day SMA target the early July low around 4400.
S&P 500 Daily Price Chart
Introduction to Technical Analysis
Moving Averages
Recommended by IG
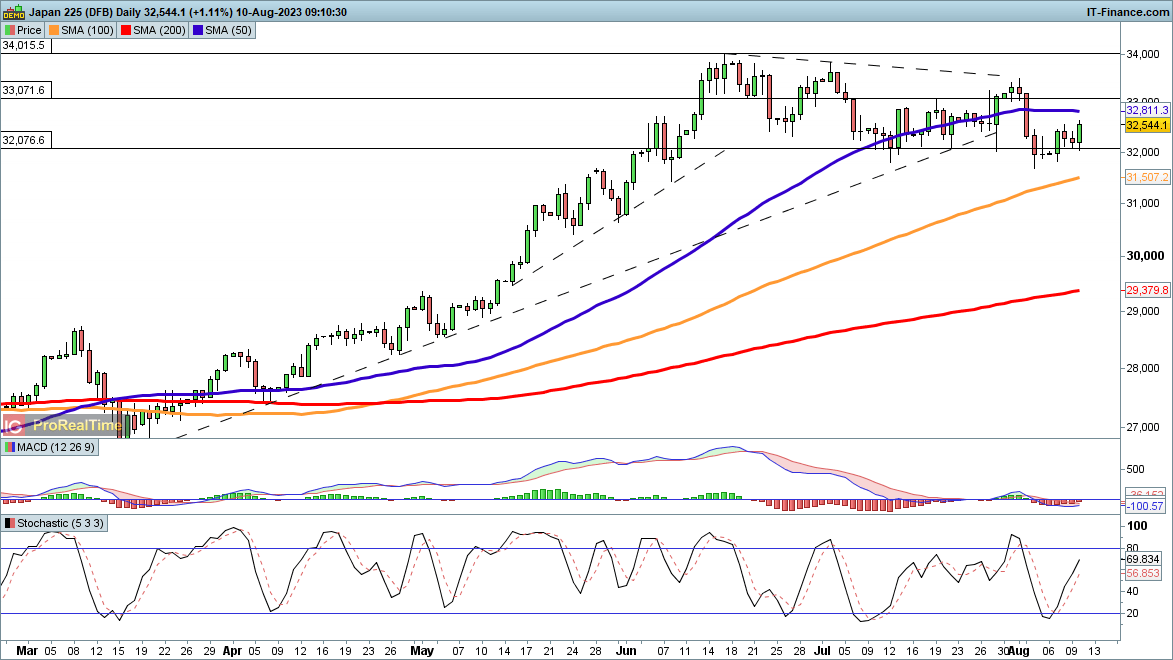
Nikkei 225 back above 32,000
The index finds itself back above 32,000 once more, as the pullback from the May highs turns into consolidation. The continued unwillingness to head below 32,000 suggests that buying pressure remains strong around this level, with a rally back above the 50-day SMA helping to suggest that a new leg higher has begun.
A close back below 32,000 and then below the recent low around 31,800 would indicate a deeper pullback is at hand.
Nikkei 225 Daily Price Chart

 آموزش مجازی مدیریت عالی و حرفه ای کسب و کار DBA


ارسال نظر شما
مجموع نظرات : 0 در انتظار بررسی : 0 انتشار یافته : 0