GOLD OUTLOOK & ANALYSIS
- Declining real yields and souring risk sentiment supports gold.
- Fed speakers to come later today as markets mull over Powell speech.
- Can overbought XAU/USD push higher?
Elevate your trading skills and gain a competitive edge. Get your hands on the Gold Q4 outlook today for exclusive insights into key market catalysts that should be on every trader’s radar.
Recommended by Warren Venketas
Get Your Free Gold Forecast
XAU/USD FUNDAMENTAL FORECAST
Gold prices capitalized on the risk off mood across financial markets while receiving an additional boost from Fed Chair Jerome Powell last night. Tensions in the Middle East have been escalating playing into the hands of the safe haven yellow metal while US government bonds received a lift across the curve (decline in US Treasury yields). Consequently, real yields (refer to graphic below) are softening making the non-interest bearing asset more attractive to investors.
US REAL YIELDS (10-YEAR)
Source: Refinitiv
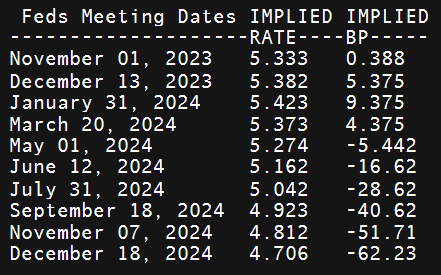
The Federal Reserve Chair signaled that the central bank is likely to keep interest rates on hold in November to gather more data and gauge the state of the US economy. That being said, there was no mention of being at the peak and that there could be scope for further monetary policy tightening if needed. From a more dovish perspective, he cited higher yields aided in keeping monetary policy conditions restrictive. Overall markets were expecting such guidance so no real surprises; however, money markets ‘dovishly’ repriced rate forecasts (see table below) with the first round of cuts expected around July as opposed to September prior to the speech.
IMPLIED FED FUNDS FUTURES

Source: Refinitiv
The economic calendar today is relatively muted and will see markets digesting yesterdays Fed comments as well as monitoring geopolitical tensions. More Fed speak will take place throughout the day but is unlikely to drive volatility as Fed Chair Powell’s address will be the focal point.
GOLD ECONOMIC CALENDAR

Source: DailyFX
Want to stay updated with the most relevant trading information? Sign up for our bi-weekly newsletter and keep abreast of the latest market moving events!
Trade Smarter – Sign up for the DailyFX Newsletter
Receive timely and compelling market commentary from the DailyFX team
Subscribe to Newsletter
TECHNICAL ANALYSIS
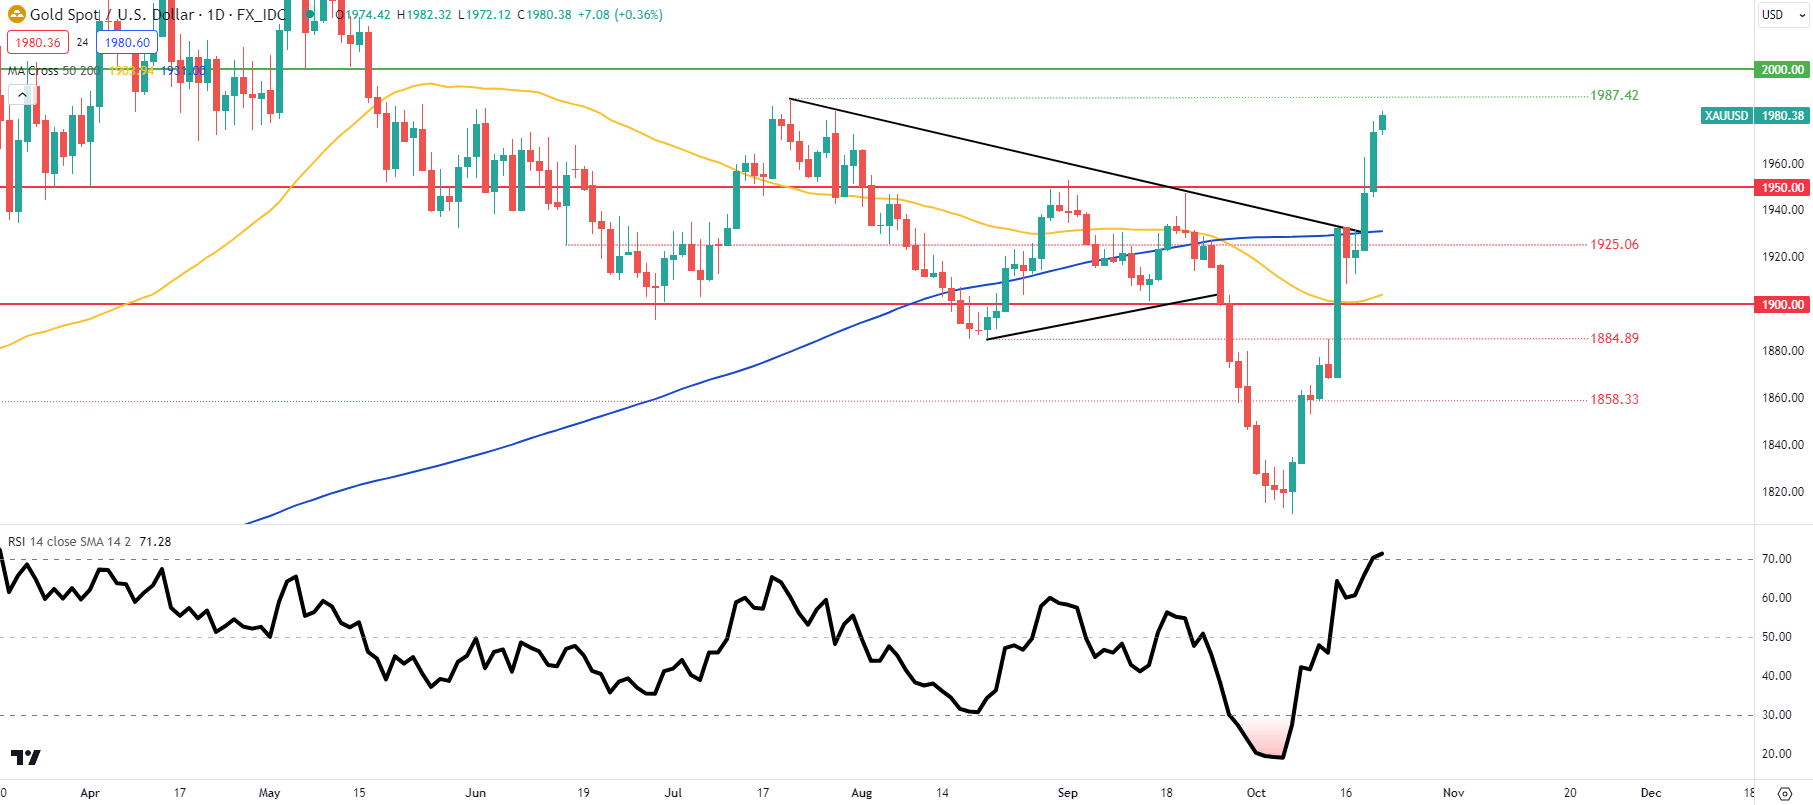
GOLD PRICE DAILY CHART

Chart prepared by Warren Venketas, IG
Daily XAU/USD price action now sees the pair trading within the overbought zone of the Relative Strength Index (RSI) as bulls look to test the 1987.42 July swing high. This comes after breaking above trendline resistance (black) and the 200-day moving average (blue). The weekend will be crucial for next week’s open and is mostly at the behest of the Israel-Hamas war. Bulls should be cautious around these extreme levels and should exercise sound risk management.
Resistance levels:
Support levels:
- 1950.00
- Trendline resistance/200-day MA (blue)
IG CLIENT SENTIMENT: BULLISH
IGCS shows retail traders are currently distinctly LONG on gold, with 64% of traders currently holding long positions (as of this writing).
Curious to learn how market positioning can affect asset prices? Our sentiment guide holds the insights—download it now!
Introduction to Technical Analysis
Market Sentiment
Recommended by Warren Venketas
Contact and followWarrenon Twitter:@WVenketas


 آموزش مجازی مدیریت عالی و حرفه ای کسب و کار DBA


ارسال نظر شما
مجموع نظرات : 0 در انتظار بررسی : 0 انتشار یافته : ۰