HANG SENG, KOSPI, STRAITS TIMES INDEX – Price Action:
- The Hang Seng Index is attempting to break below a crucial support.
- Kospi’s upward pressure has eased.
- FTSE Straits Times Index is back at the lower end of the multi-month range.
- What is the outlook and the key levels to watch in select Asian indices?
Recommended by Manish Jaradi
Building Confidence in Trading
Hang Seng Index: Downward momentum is picking up
The Hang Seng Index (HSI) is looking vulnerable as it struggles to hold above crucial support at the May low of 18045, slightly above the lower edge of a declining channel since early 2023 (at about 17000). The increased weakness is a result of a failed attempt earlier this month to rise past a key ceiling at the mid-June high of 20155.
Hang Seng Index Daily Chart
Chart Created Using TradingView
Downward momentum appears to be picking up after the cross below 18045. And any break below 17000 could open the way initially toward the November 2022 low of 16830. On the upside, HSI needs to overcome the vital ceiling in 20155 for the immediate bearish risks to fade.
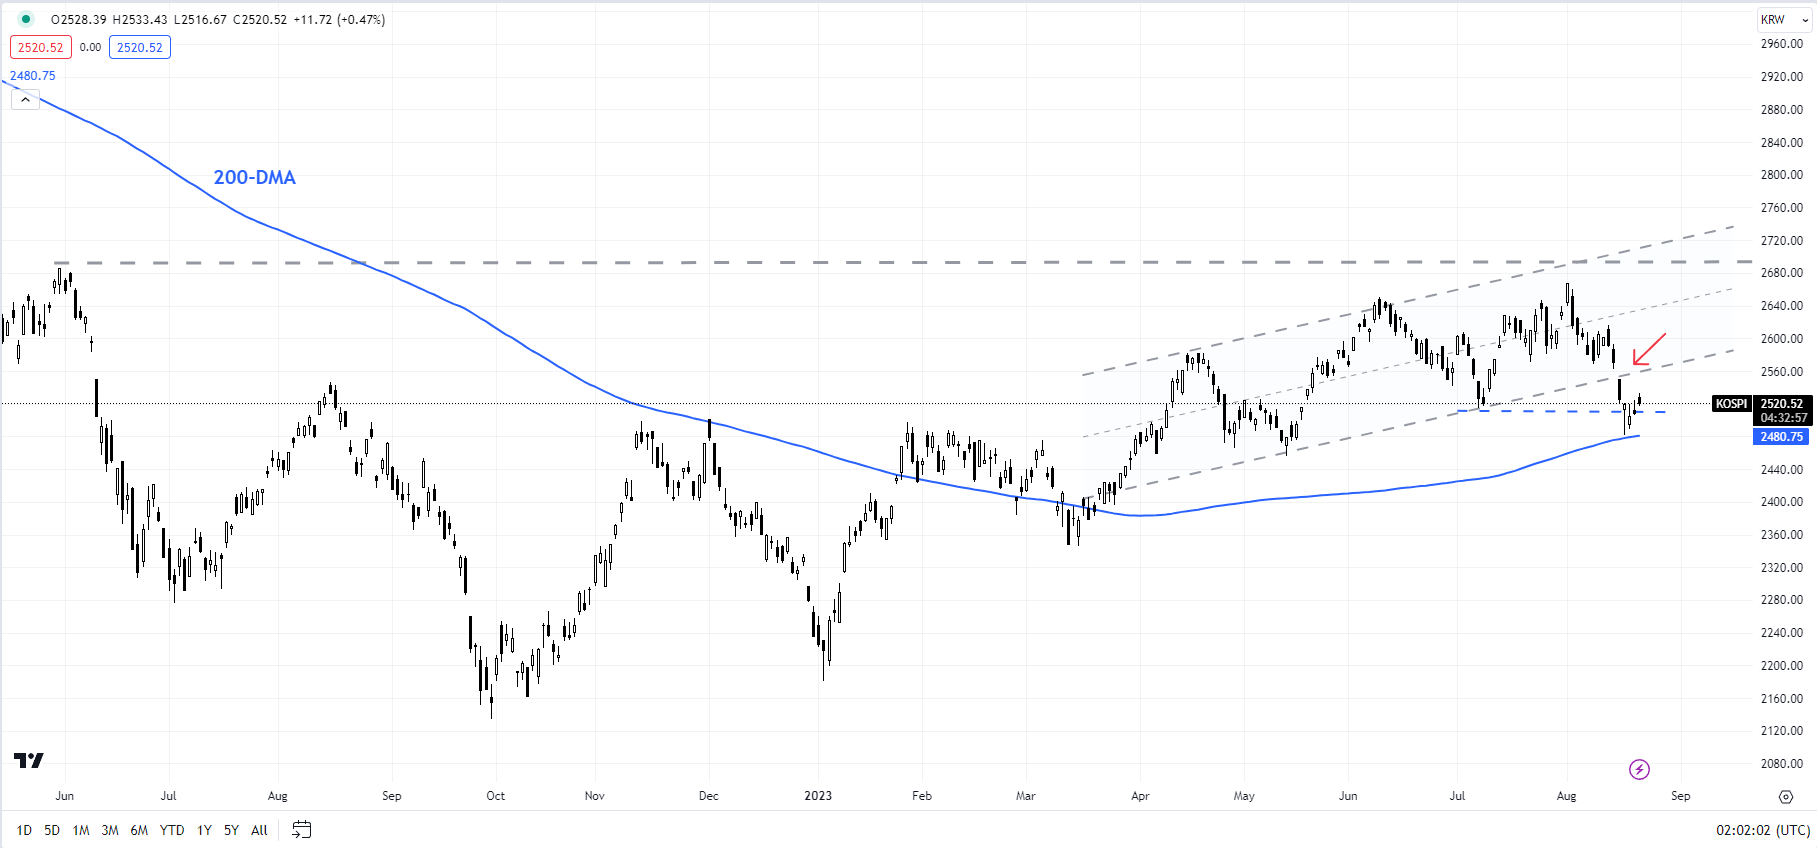
Kospi: Eight-month rally is turning
Kospi’s break last week below vital support at the July low of 2515 confirms that the multi-week upward pressure has eased. This is the first time Kospi has broken pivot support since the rally began at the beginning of 2023. The break follows a fall below another vital floor on the lower edge of the Ichimoku cloud on the daily charts – for the first time since January.
Kospi Daily Chart

Chart Created Using TradingView
The index’s fall below 2515 has triggered a minor double top (the June and August highs), potentially opening the way toward 2380. Major support is at the March low of 2350 – the index needs to remain above this support if the eight-month-long rally has to extend.
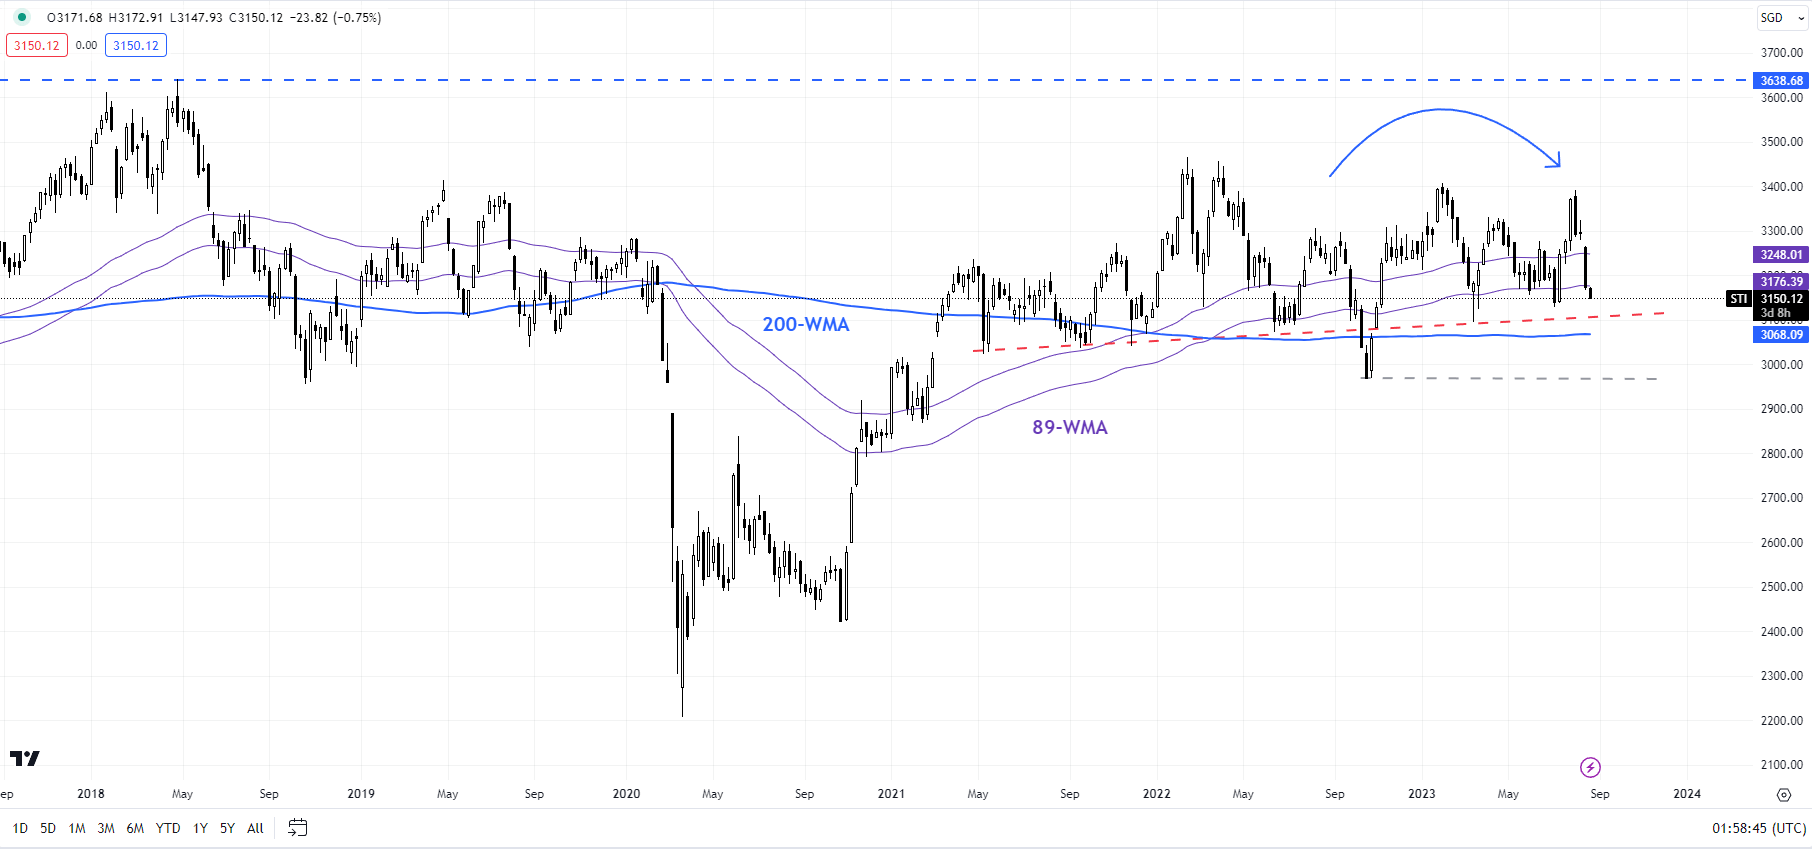
FTSE Straits Times Index: At multiple times tested support
Singapore’s FTSE Straits Times Index is back at the lower end of the multi-month range at about 2950-3050, including the 200-week moving average and the October low of 2960. While a break below isn’t imminent – it could well rebound as it has done multiple times since 2021. However, any break below could raise the odds that the post-Covid rebound is over, putting the index back within a very broad range of 2200-3500 (including the 2020 low and the 2022 high).
FTSE Straits Times Index Weekly Chart

Chart Created Using TradingView
For the bullishness to resume, a crack above resistance at the 2022 high would be needed. Until then, the path of least resistance remains sideways to down.
Recommended by Manish Jaradi
How to Trade the “One Glance” Indicator, Ichimoku
— Written by Manish Jaradi, Strategist for DailyFX.com
— Contact and follow Jaradi on Twitter: @JaradiManish


 آموزش مجازی مدیریت عالی و حرفه ای کسب و کار DBA


ارسال نظر شما
مجموع نظرات : 0 در انتظار بررسی : 0 انتشار یافته : ۰