

Gold, Retail Trader Positioning, Technical Analysis – IGCS Update
- Gold prices extend losses on rising Treasury yields
- Retail traders are becoming even more bullish XAU
- With prices extending the downtrend, what are key levels ahead?
Recommended by Daniel Dubrovsky
Get Your Free Gold Forecast
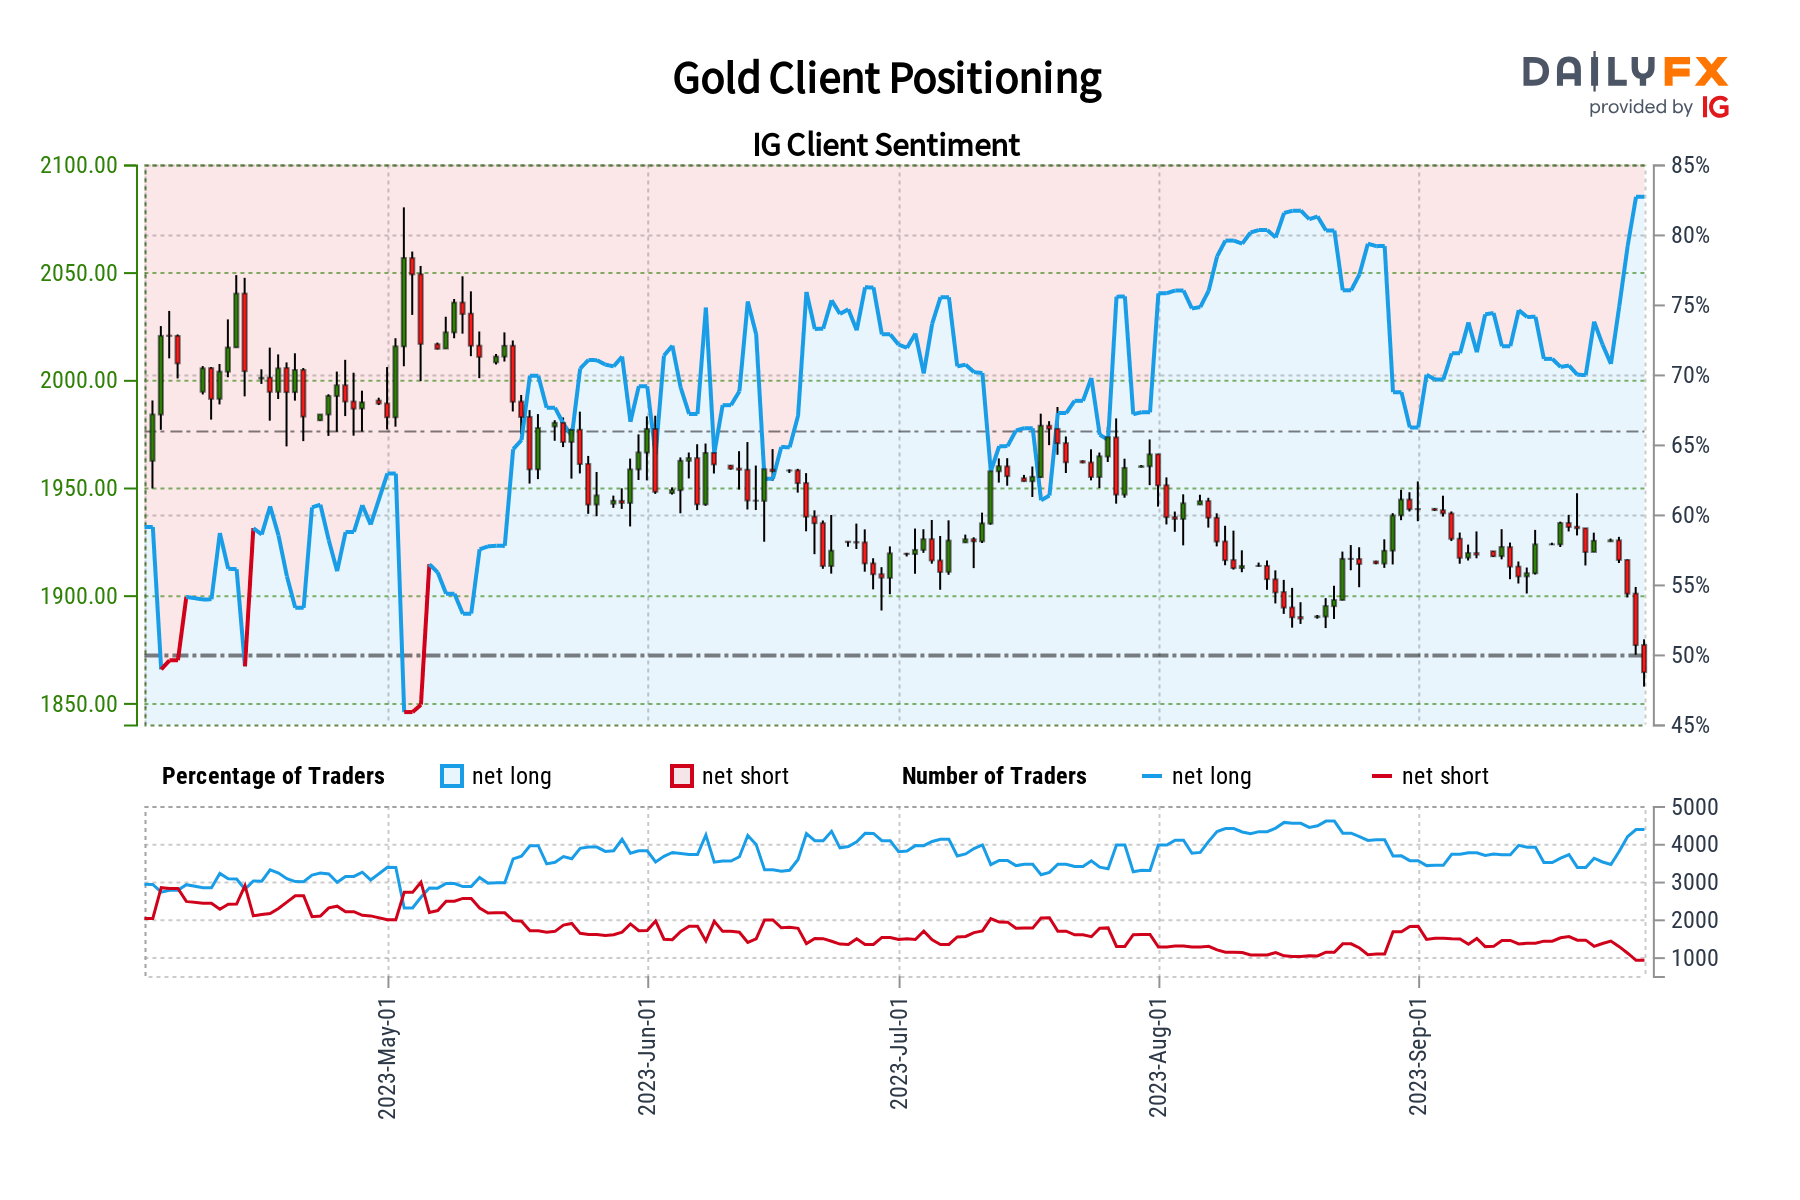
Gold prices have been sinking in recent days, succumbing to a stronger US Dollar and rising Treasury yields. In response, retail traders have been becoming more bullish XAU/USD. This can be seen by looking at IG Client Sentiment (IGCS), which usually functions as a contrarian indicator. With that in mind, could further pain be in store for the yellow metal?
Gold Sentiment Outlook – Bearish
The IGCS gauge shows that a commanding majority of 82% are net-long XAU/USD. Since most of them are biased to the upside, this continues to hint that prices may fall down the road. This is as upside exposure has increased by 6.74% and 22.71% compared to yesterday and last week, respectively. With that in mind, the combination of overall bets and recent changes offers a stronger bearish contrarian outlook.
| Change in | Longs | Shorts | OI |
| Daily | 7% | -7% | 4% |
| Weekly | 23% | -26% | 10% |
XAU/USD Daily Chart
On the daily chart below, gold has confirmed a breakout under rising support from February. That is increasingly offering a stronger bearish technical bias. Now, immediate support is the midpoint of the Fibonacci retracement around 1848.
Prices may bounce here, opening the door to revisiting the August swing low around 1884.89. Otherwise, clearing lower exposes the February low of 1804.78, opening the door to continuing the top in prices since earlier this year.
Recommended by Daniel Dubrovsky
How to Trade Gold
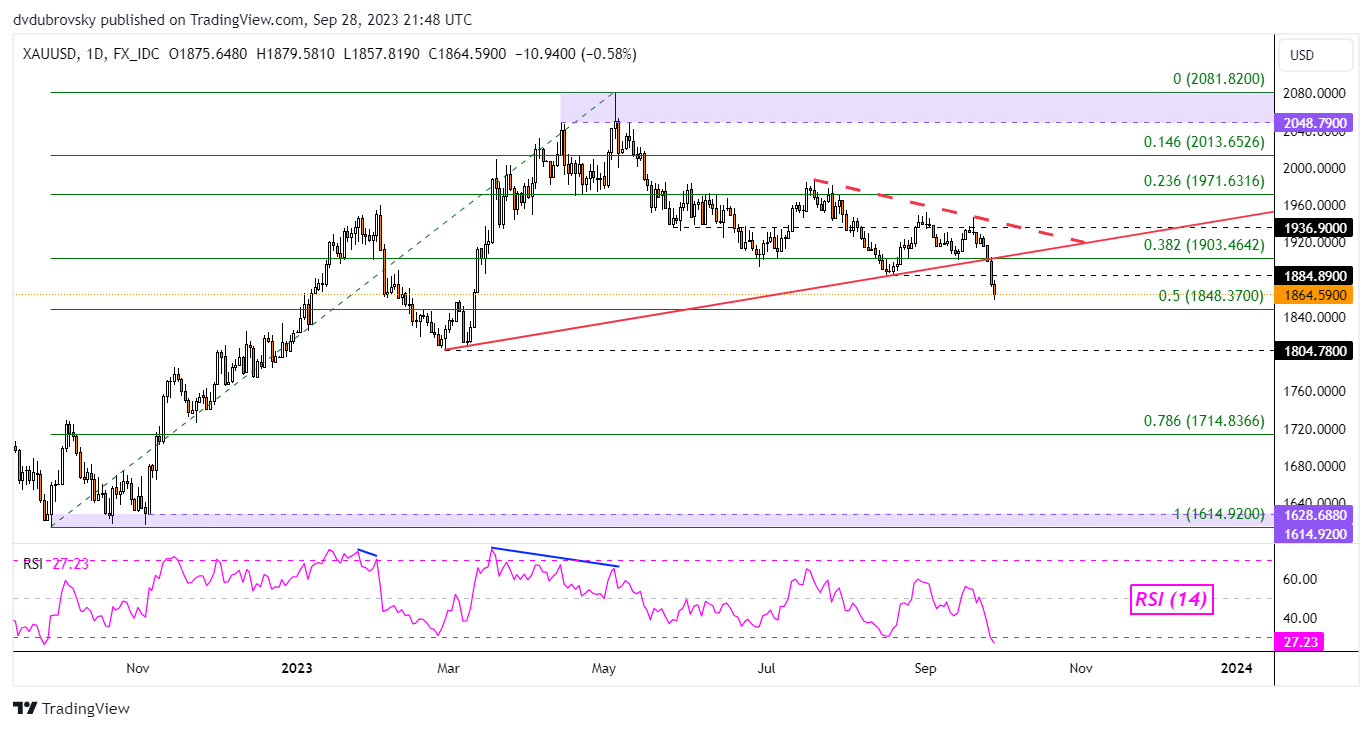
Chart Created in Trading View
— Written by Daniel Dubrovsky, Senior Strategist for DailyFX.com

 آموزش مجازی مدیریت عالی و حرفه ای کسب و کار DBA


ارسال نظر شما
مجموع نظرات : 0 در انتظار بررسی : 0 انتشار یافته : 0