Gold, Silver Analysis
Recommended by Richard Snow
Get Your Free Gold Forecast
Higher Rates, Yields, USD and now More Job Openings too
A shock surprise in US job openings data revealed that more than 9.6 million jobs in the US have gone abegging. The consensus estimate hinted at only 8.15 million as the job market made modest progress which has largely been wiped out in one month.
But how do job openings affect the gold market? In this interconnected world where market expectations guide price discovery, the connection arises through elevated interest rate expectations and a stronger dollar as a result. If the labour market remains tight, the Fed may feel obliged to hike interest rates for the last time (theoretically) which boosts the value of the dollar – making foreign purchases of gold more expensive.
US 10-year yields rose around 4 basis points after the data was released and appears on track for levels last seen in 2007, with 5% in sight.
US 10-Year Bond Yields (Weekly Chart)
Source: TradingView, prepared by Richard Snow
Gold on Track for Seventh Straight Day of Declines
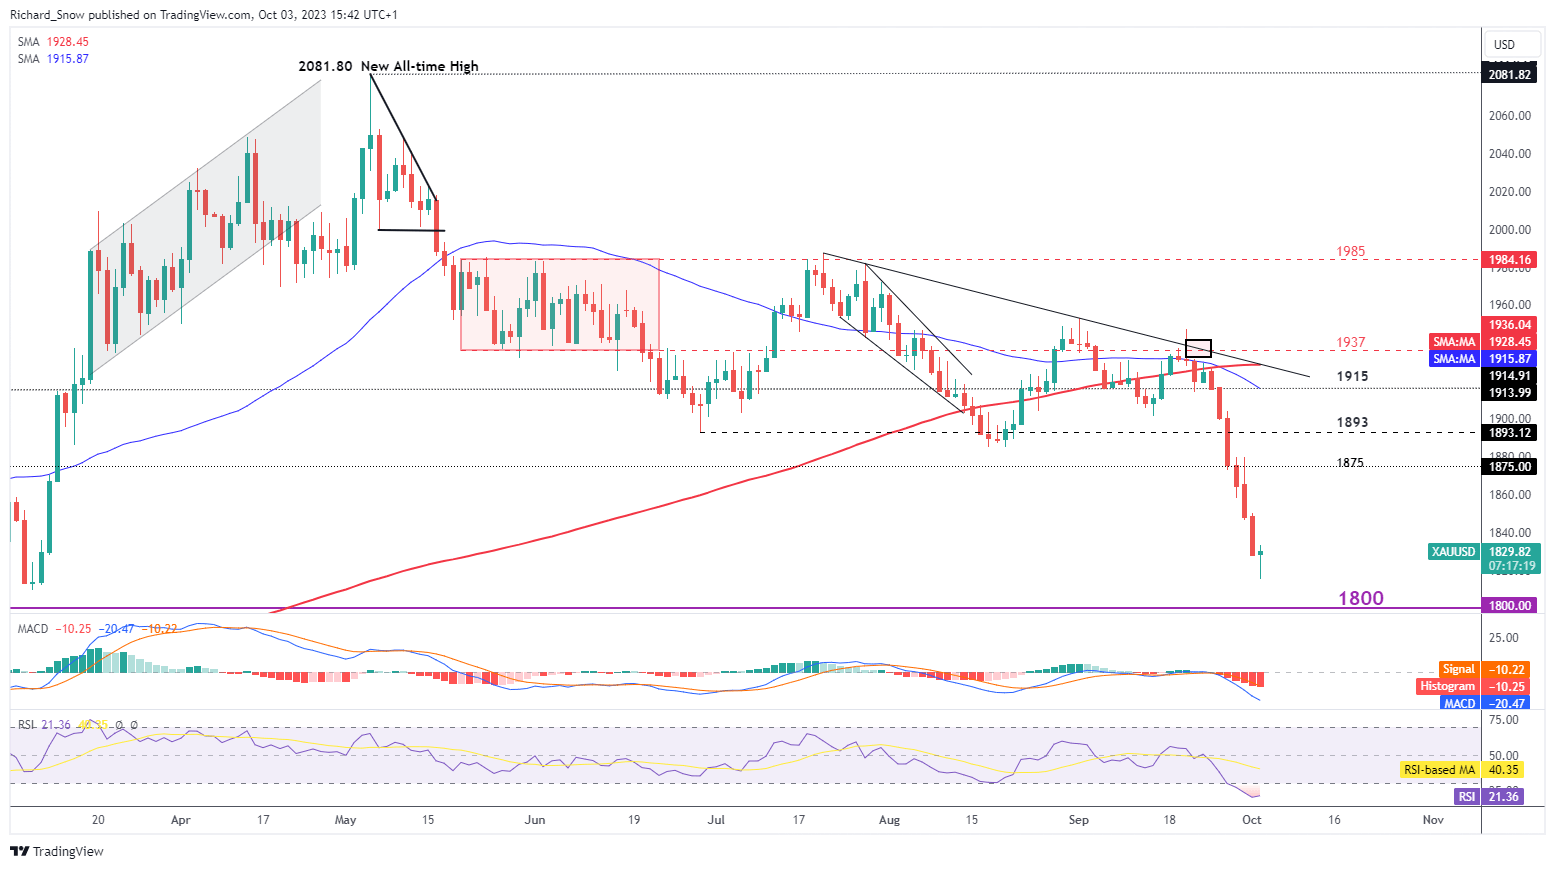
Gold prices have plummeted over the last week as there appears no end in sight for rising US yields. Not even two weeks ago, gold prices touched trendline resistance and since then have plummeted at a rate of knots, passing the 200 simple moving average (SMA) with ease. A death cross has also been confirmed – adding further conviction to the downside. Now, the psychological level of 1800 is next up for gold. It remains to be seen whether it can halt the relentless selloff.
Gold Daily Chart

Source: TradingView, prepared by Richard Snow
Recommended by Richard Snow
How to Trade Gold
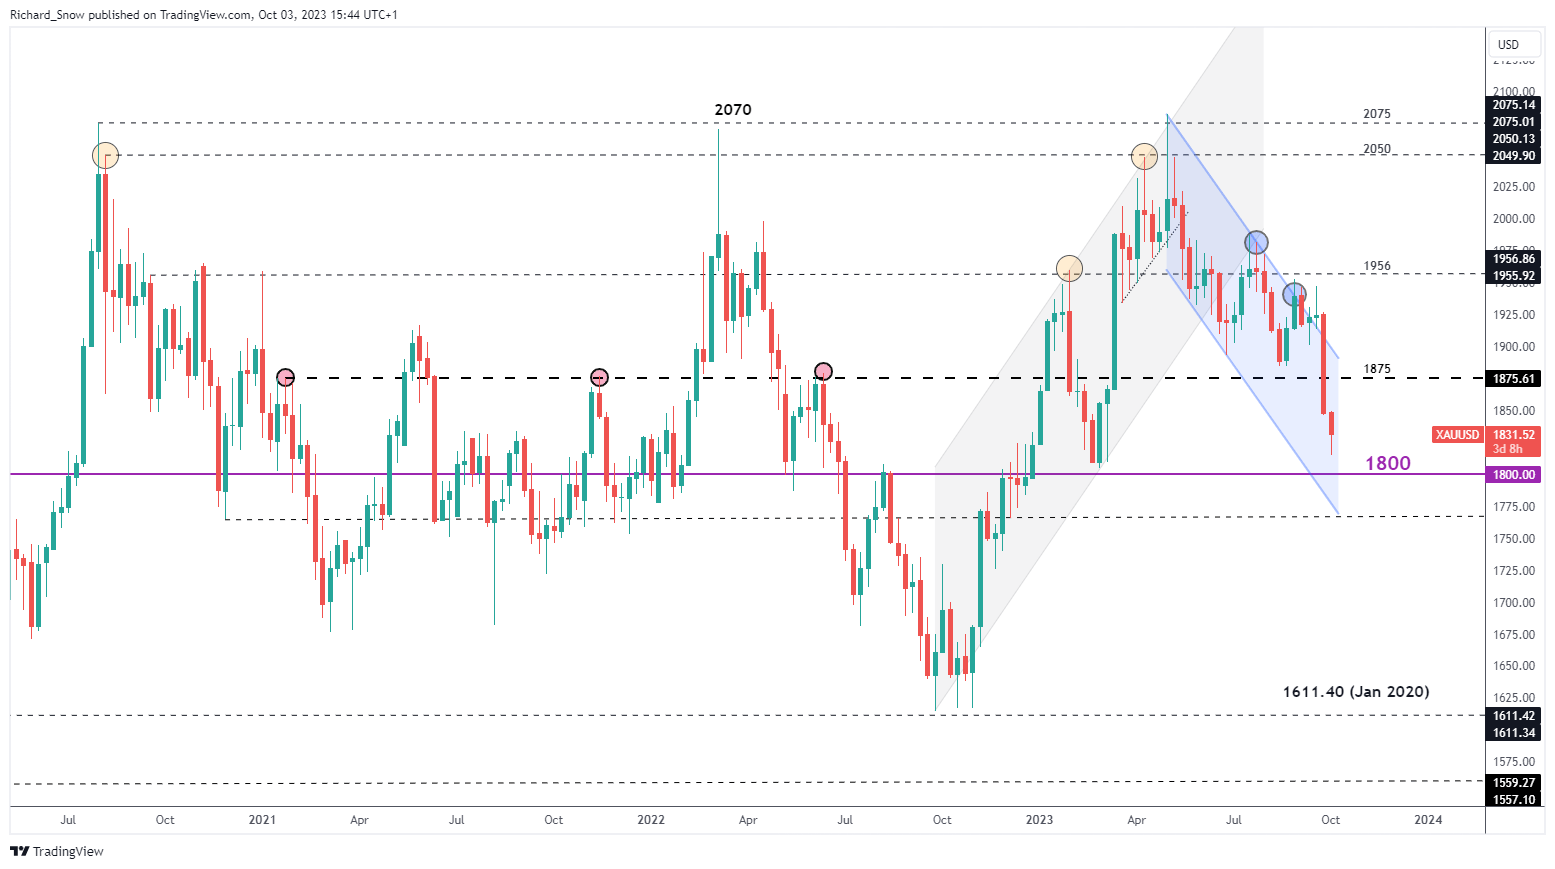
The weekly chart helps put the move into perspective. Gold prices have been trending lower – within a descending channel – since April. Closing levels of recent weeks hinted at an upside breakout but ultimately there was no follow through. Thereafter, a continuation in the downside trend ensued just at an alarming rate.
Gold Weekly Chart

Source: TradingView, prepared by Richard Snow
Silver at Risks of Over-Extending, Tests Support
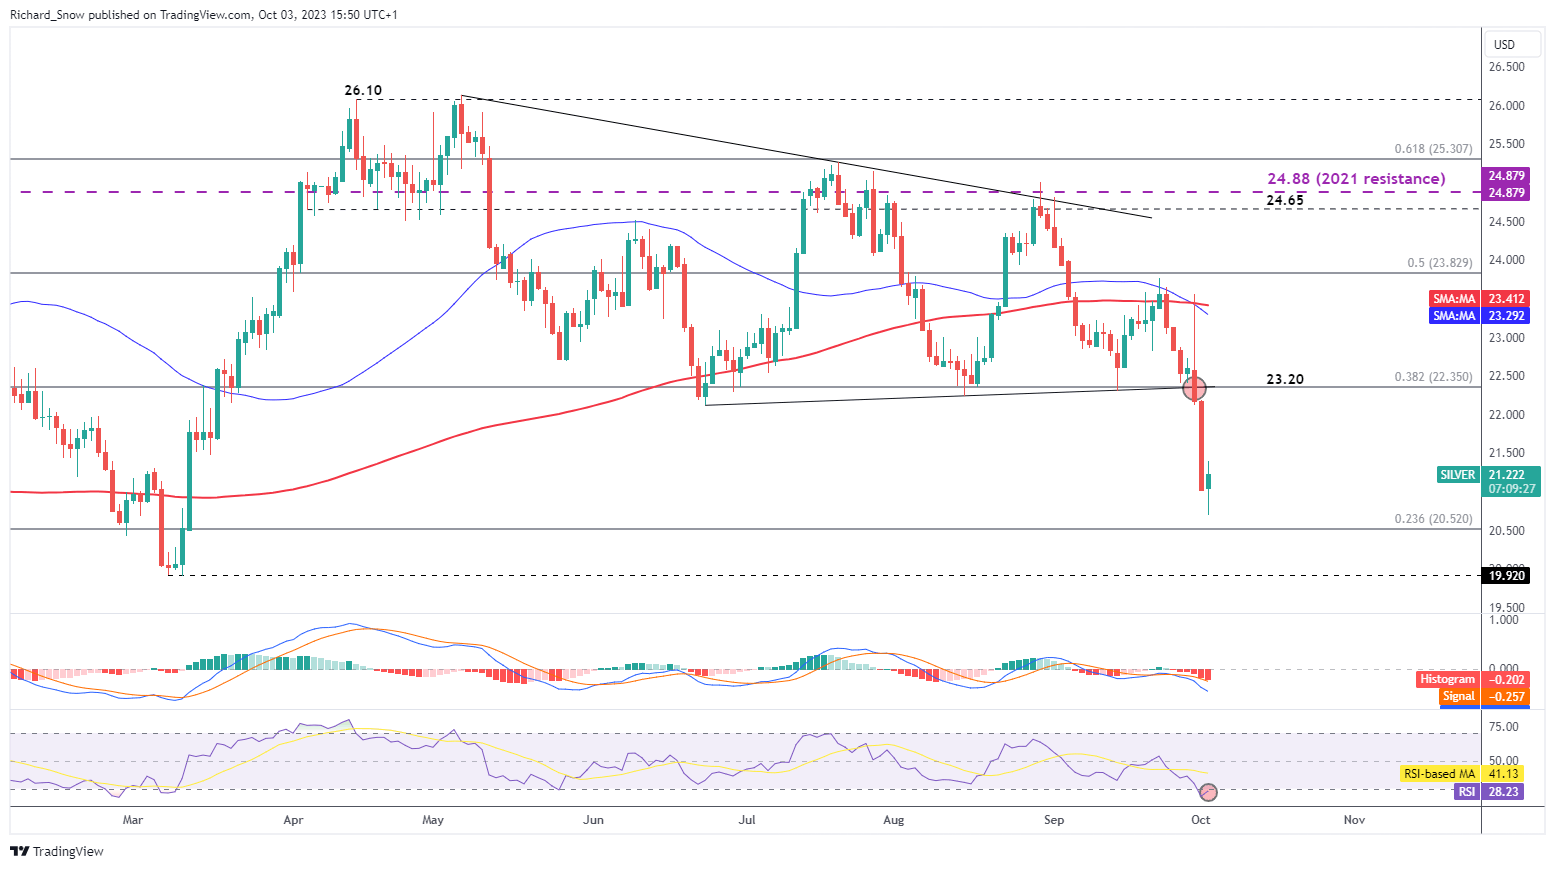
Silver tends to follow gold but has exhibited greater fluctuations. For example, Friday’s spike higher almost engulfed the entire downside move that had built up thus far. A massive intra-day reversal sparked massive selling on Monday. Friday’s close beneath 23.20 was rather telling. The level comprises of both trendline support and the 38.2% Fibonacci level of the 2021 to 2022 major move.
Today however, prices appear to be holding up 20.52 which represents the 23.6% Fibonacci level. 20.52 is immediate support with further selling bringing 19.90 into focus. However, bear in mind the RSI has ventured into oversold territory, meaning it would not be unusual for prices to pullback after overextending over such a short period of time.
Silver Daily Chart

Source: TradingView, prepared by Richard Snow
Trade Smarter – Sign up for the DailyFX Newsletter
Receive timely and compelling market commentary from the DailyFX team
Subscribe to Newsletter
— Written by Richard Snow for DailyFX.com
Contact and follow Richard on Twitter: @RichardSnowFX


 آموزش مجازی مدیریت عالی و حرفه ای کسب و کار DBA


ارسال نظر شما
مجموع نظرات : 0 در انتظار بررسی : 0 انتشار یافته : ۰