

Gold (XAU/USD) Analysis, Price, and Chart
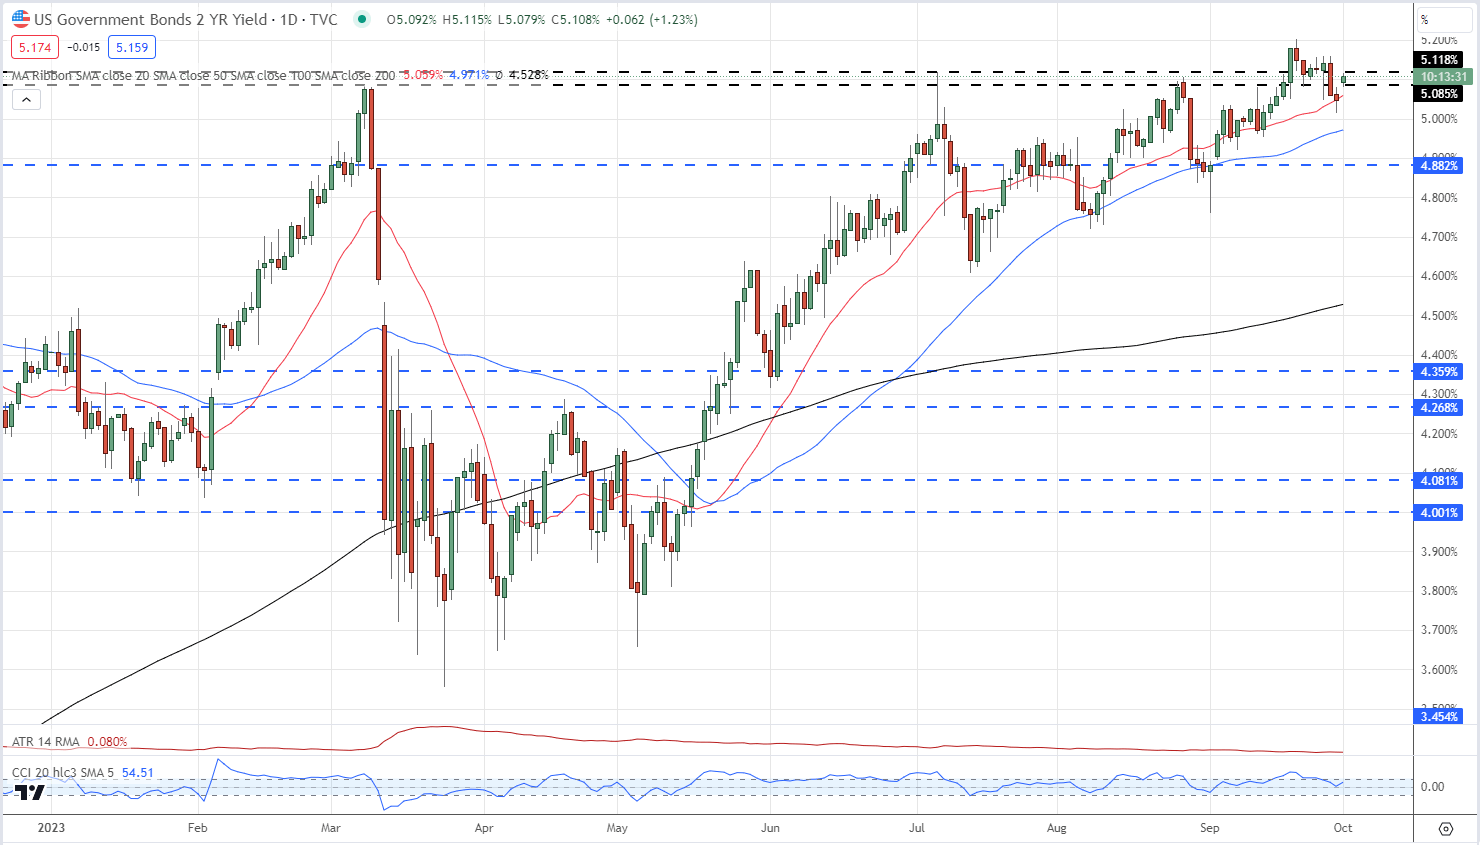
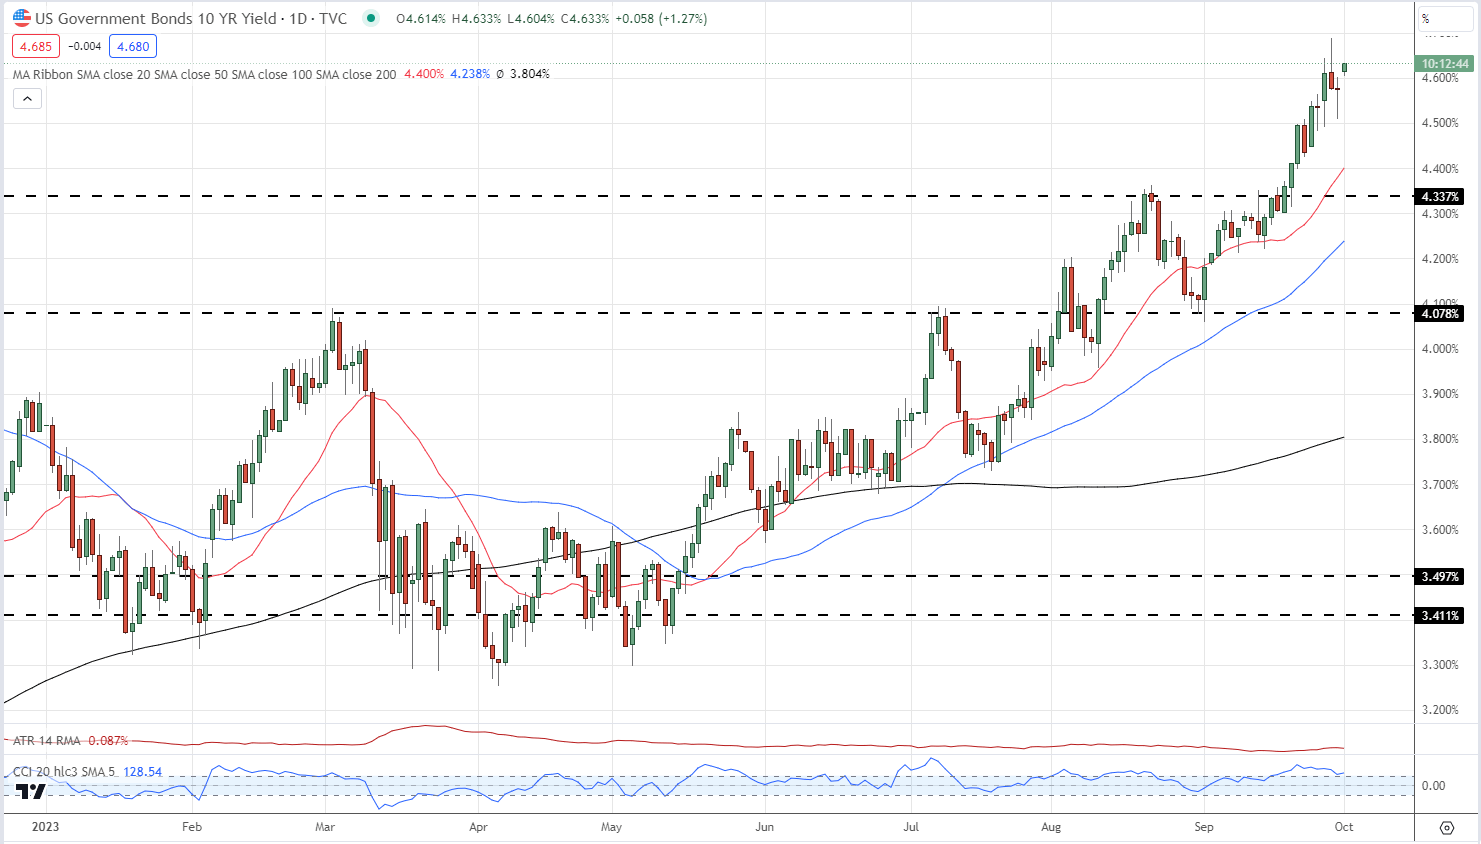
- US Treasury yields remain near recent multi-year peaks.
- Gold is closing in on the late-February low at $1,805/oz.
Download our brand new Q4 Gold Forecast
Recommended by Nick Cawley
Get Your Free Gold Forecast
US Treasury yields remain within touching distance of multi-year highs head of a speech later in the session by Fed Chair Jerome Powell. While financial markets are attributing a near 75% probability that the US central bank will leave rates unchanged at the November 1st meeting, further out that probability drops to mid-50%.
CME FedWatch Probabilities Tool
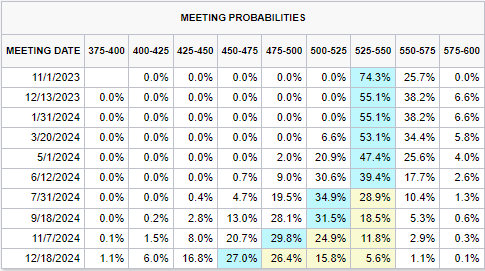
Elevated US bond yields are weighing heavily on gold and silver and with yields expected to stay elevated in the near future, the going looks tough for gold. While these bond yields are high, it may be that they are close to their short-term peaks if rates are not going to move higher. A week packed full of US jobs data, and the previously mentioned speech by Chair Powell will decide the near-term direction for US government debt.
US Treasury 2yr Yield Daily Chart
US Treasury 10yr Yield Daily Chart
Recommended by Nick Cawley
How to Trade Gold
DailyFX Economic Calendar
Gold continues to print bearish candles with the precious metal losing nearly 6% of its value since September 20th. The break and open below the cluster of all three simple moving averages at the start of last week accelerated the sell-off, while prior support between $1,893/oz. and $1,885/oz. failed to stem the move lower. A prior swing low at $1,805/oz. is now the next level of support before the 61.8% Fibonacci retracement level at $1,794/oz. comes into play. The CCI indicator is in oversold territory due to the recent sell-off and this may slow further losses until the reading normalizes.
Gold Daily Price Chart – October 2, 2023
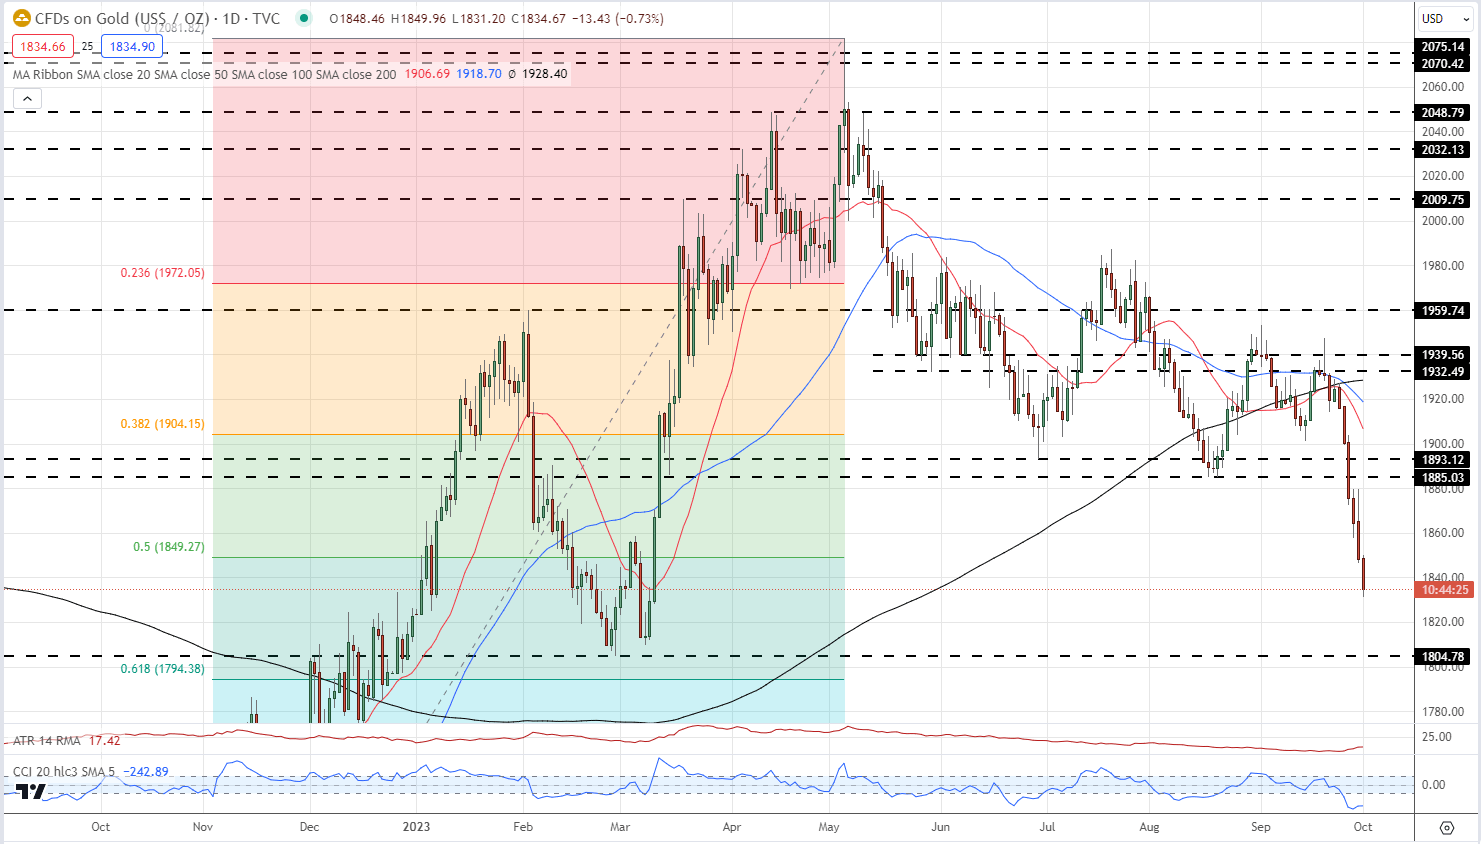
Chart via TradingView
See our Latest Daily and Weekly Gold Sentiment Report
| Change in | Longs | Shorts | OI |
| Daily | 3% | 21% | 5% |
| Weekly | 34% | -38% | 13% |
What is your view on Gold and Silver – bullish or bearish?? You can let us know via the form at the end of this piece or you can contact the author via Twitter @nickcawley1.

 آموزش مجازی مدیریت عالی و حرفه ای کسب و کار DBA


ارسال نظر شما
مجموع نظرات : 0 در انتظار بررسی : 0 انتشار یافته : 0