

Gold and Silver: Near-Term Technical Update
- Gold and silver prices weakened on Monday
- XAU/USD inches closer to key rising support
- XAG/USD might have more room to consolidate.
Recommended by Daniel Dubrovsky
How to Trade Gold
XAU/USD Analysis
Gold and silver prices have continued lower amid the rise in longer-term US Treasury yields and a stronger US Dollar. As a result, how is the near-term technical landscape evolving in precious metals?
Gold continues to trade in a directionless flow from a near-term technical perspective. Prices are consolidating between the falling trendline from July and rising support from February – see chart below. Broadly speaking, XAU/USD remains unchanged form levels seen in mid-2020.
With each passing day, the yellow metal is running out of room to consolidate between support and resistance. As such, the direction of the breakout could be key for the coming trend. Below, watch the August low of 1884.89. Above, resistance seems to be the 23.6% Fibonacci retracement level of 1971.63.
| Change in | Longs | Shorts | OI |
| Daily | 9% | -10% | 3% |
| Weekly | 3% | -14% | -2% |
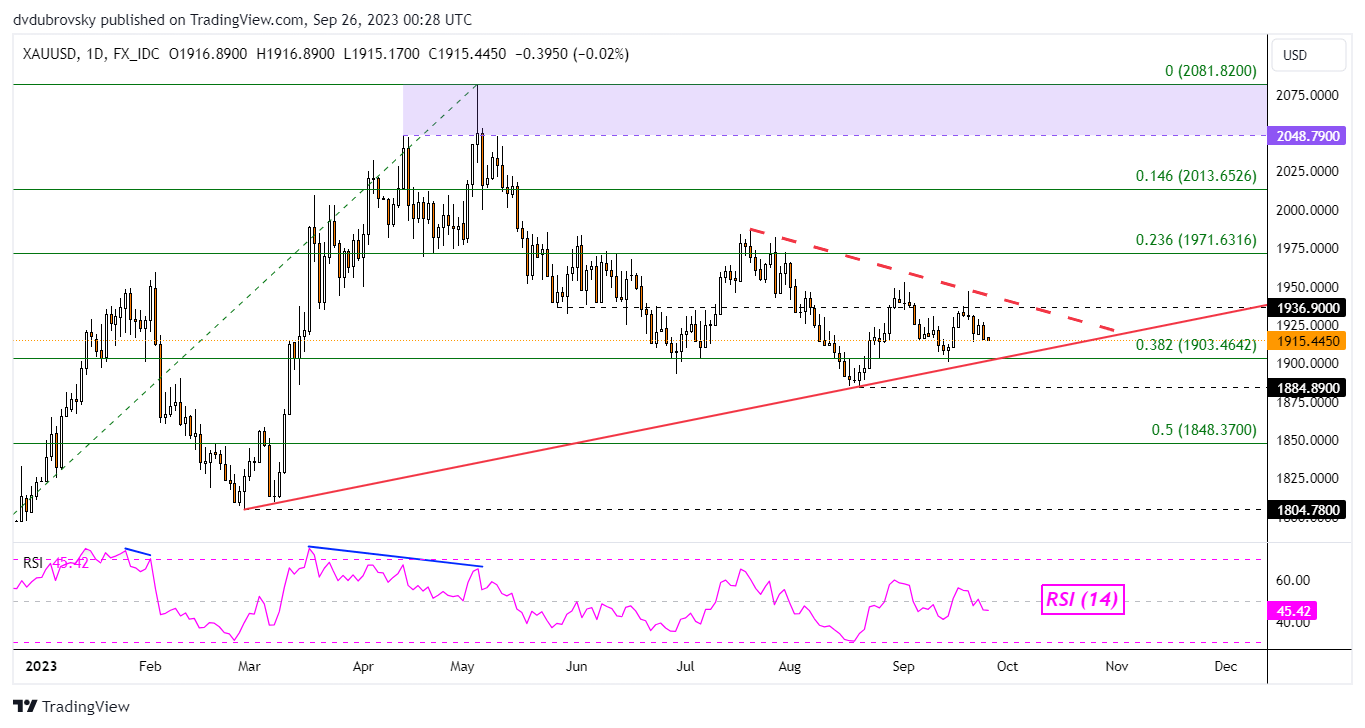
Chart Created in TradingView
XAG/USD Analysis
Meanwhile, silver faces a similar setting. Like gold, XAG/USD is consolidating between rising support and resistance. The difference here is that there is still plenty of room left for sideways price action. As such, XAG/USD could be left directionless for a longer period of time than gold.
Silver’s drop on Monday has brought it to the midpoint of the Fibonacci retracement level at 23.02. As such, it is also sitting just above rising support from the end of last year. A meaningful breakout likely entails a push under the 61.8% Fibonacci retracement level of 22.29.
That exposes the 78.6% point at 21.24. Otherwise, a turn higher places the focus on the 38.2% level at 23.75. Just above that is the falling zone of resistance since May.
| Change in | Longs | Shorts | OI |
| Daily | 1% | -17% | -1% |
| Weekly | -10% | 13% | -8% |
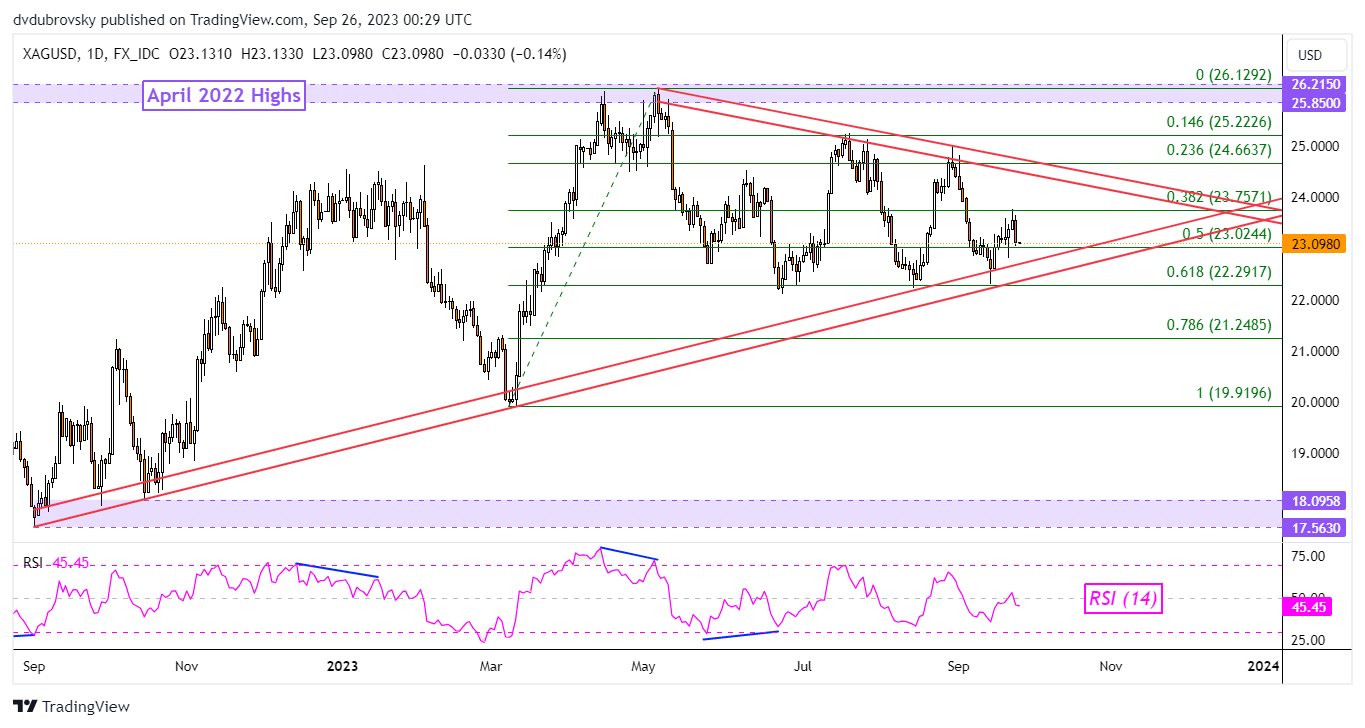
Chart Created in TradingView
— Written by Daniel Dubrovsky, Contributing Senior Strategist for DailyFX.com

 آموزش مجازی مدیریت عالی و حرفه ای کسب و کار DBA


ارسال نظر شما
مجموع نظرات : 0 در انتظار بررسی : 0 انتشار یافته : 0