

Gold and Silver: Near-Term Technical Update
- Gold and silver prices take a breather from losses
- This is allowing support levels to be reinforced
- What are key levels to watch in the event of breakouts?
Recommended by Daniel Dubrovsky
Get Your Free Gold Forecast
XAU/USD Analysis
In recent days, gold and silver prices have pressed the brakes, bringing their losing streak since late September to a pause. Given recent price action, how is the near-term technical outlook shaping up for precious metals?
On the daily chart below, we can see that gold has confirmed a breakout under rising support from earlier this year. Meanwhile, a bearish Death Cross has recently formed between the 50- and 200-day moving averages. As such, the technical outlook remains broadly focused on the downside.
In recent days, prices have confirmed a breakout under the midpoint of the Fibonacci retracement level of 1848.37. That is now placing the focus on the current 2023 low of 1804.78 as immediate support. As such, a bounce is possible. However, the moving averages may hold as resistance, maintaining the broader downside focus.
Otherwise, extending lower exposes the 78.6% Fibonacci retracement level of 1714.83 as a medium-term bearish objective.
Recommended by Daniel Dubrovsky
How to Trade Gold
Gold Daily Chart
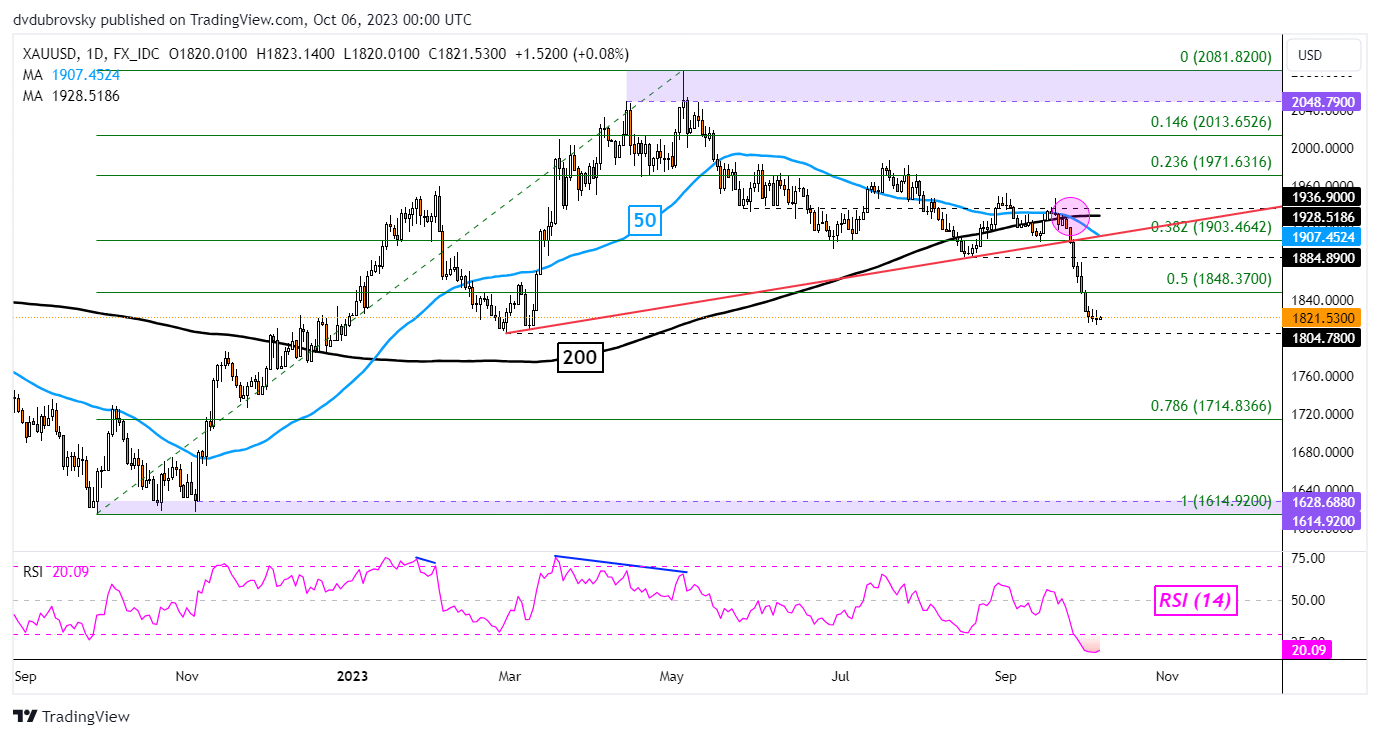
Chart Created in TradingView
XAG/USD Analysis
Meanwhile, silver prices are facing a similar landscape. Like gold, XAG/USD has confirmed a breakout above rising support. Losses in the previous week have brought prices to test support, which is the 61.8% Fibonacci retracement level of 20.83.
A hold at support and subsequent bounce would shift the focus on the midpoint of the Fibonacci retracement here as well, around 21.85. The latter may hold as resistance, potentially reinstating the near-term bearish perspective.
Otherwise, continuing lower from here exposes the 78.6% level of 19.39 before the 17.56 – 18.09 support zone from last year comes into focus.
{ICGS Silver}
Silver Daily Chart
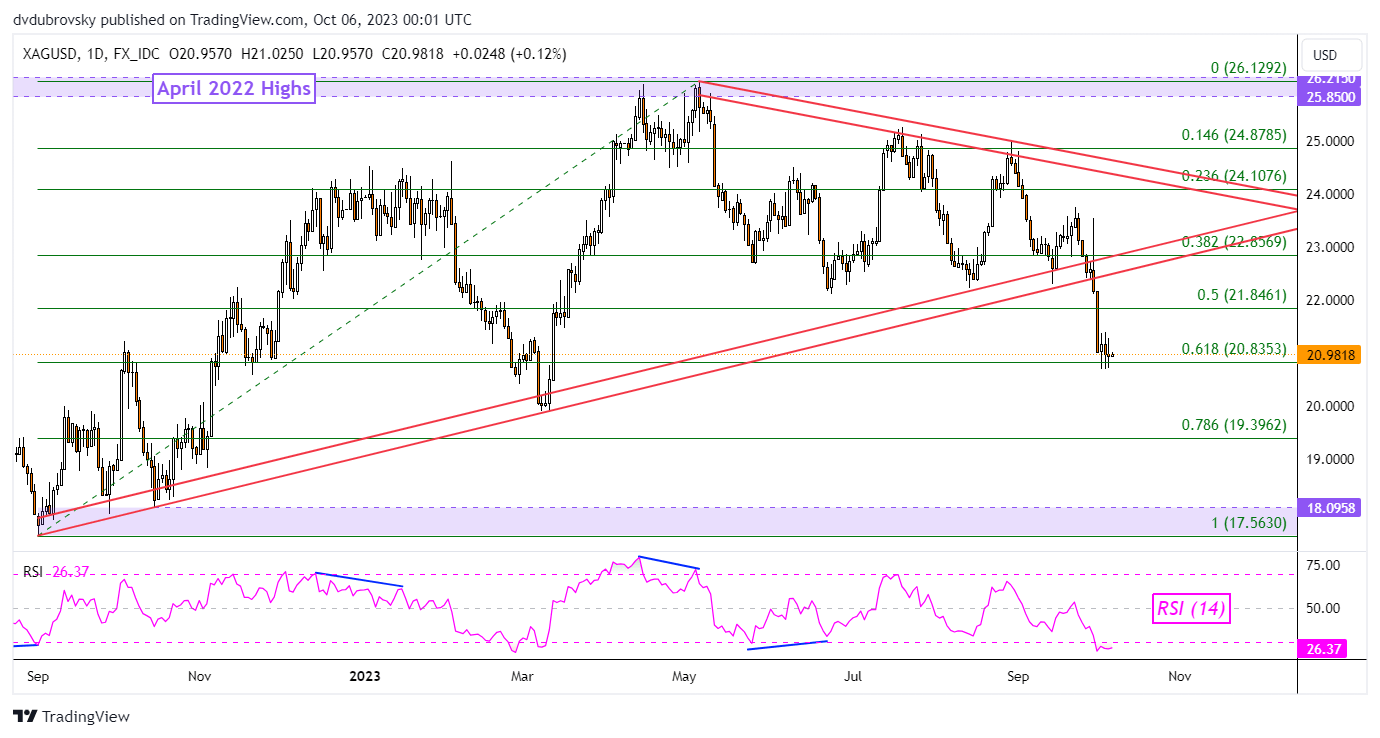
Chart Created in TradingView
— Written by Daniel Dubrovsky, Senior Contributing Strategist for DailyFX.com

 آموزش مجازی مدیریت عالی و حرفه ای کسب و کار DBA


ارسال نظر شما
مجموع نظرات : 0 در انتظار بررسی : 0 انتشار یافته : 0