British Pound, GBP/USD, EUR/GBP – Technical Update:
- British Pound eyeing key levels of support ahead
- GBP/USD bearish Head & Shoulders still in play
- EUR/GBP recent dip places focus on key range
Recommended by Daniel Dubrovsky
How to Trade GBP/USD
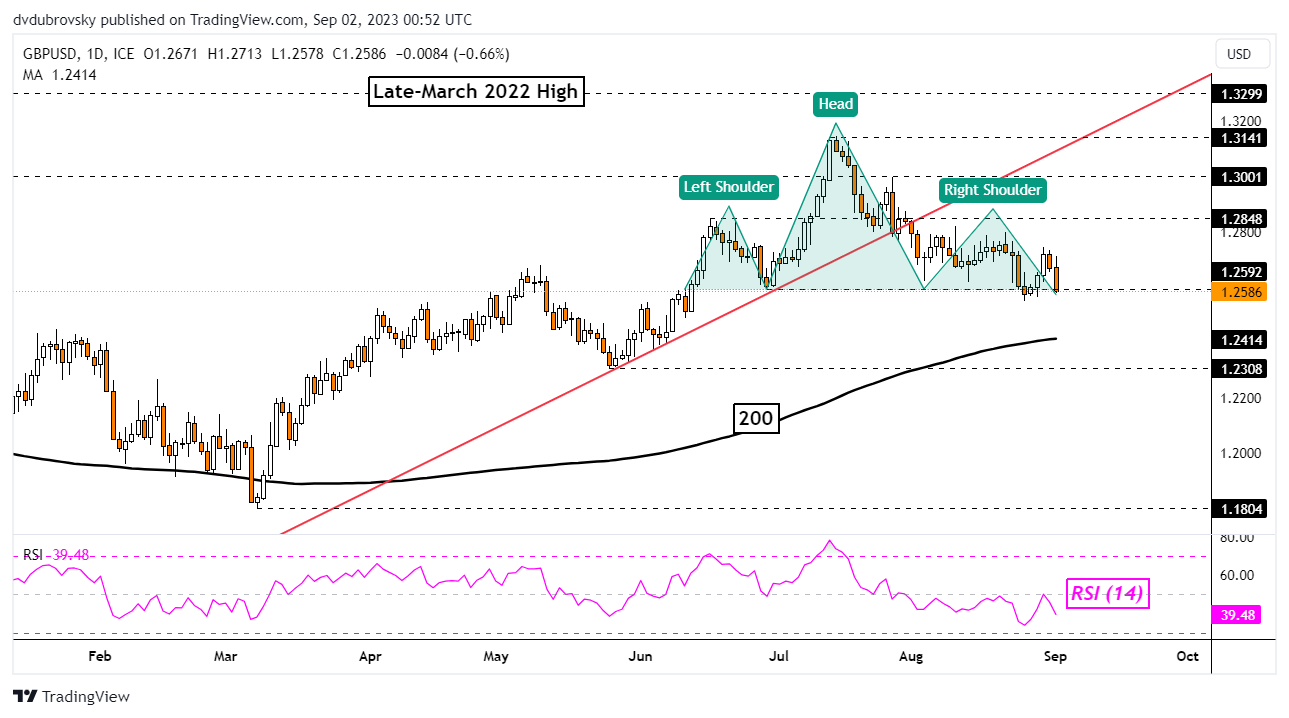
The British Pound still remains vulnerable to the US Dollar as the new week begins. On the daily chart below, GBP/USD can be seen hovering on the neckline of a bearish Head & Shoulders chart formation around 1.2648. Watching how price action develops in the near term will be key. A breakout lower, with confirmation, could open the door to an increasingly stronger bearish technical bias.
That would place the focus on the 200-day Moving Average (MA), which could reinstate the broader upside focus. If not, prices may revisit the May low of 1.2308. Otherwise, a turn higher places the focus on key resistance around 1.2848. Further gains beyond that sits the 1.3 inflection point which was established in March 2022.
| Change in | Longs | Shorts | OI |
| Daily | 6% | -14% | -3% |
| Weekly | 0% | -4% | -2% |

Chart Created in TradingView
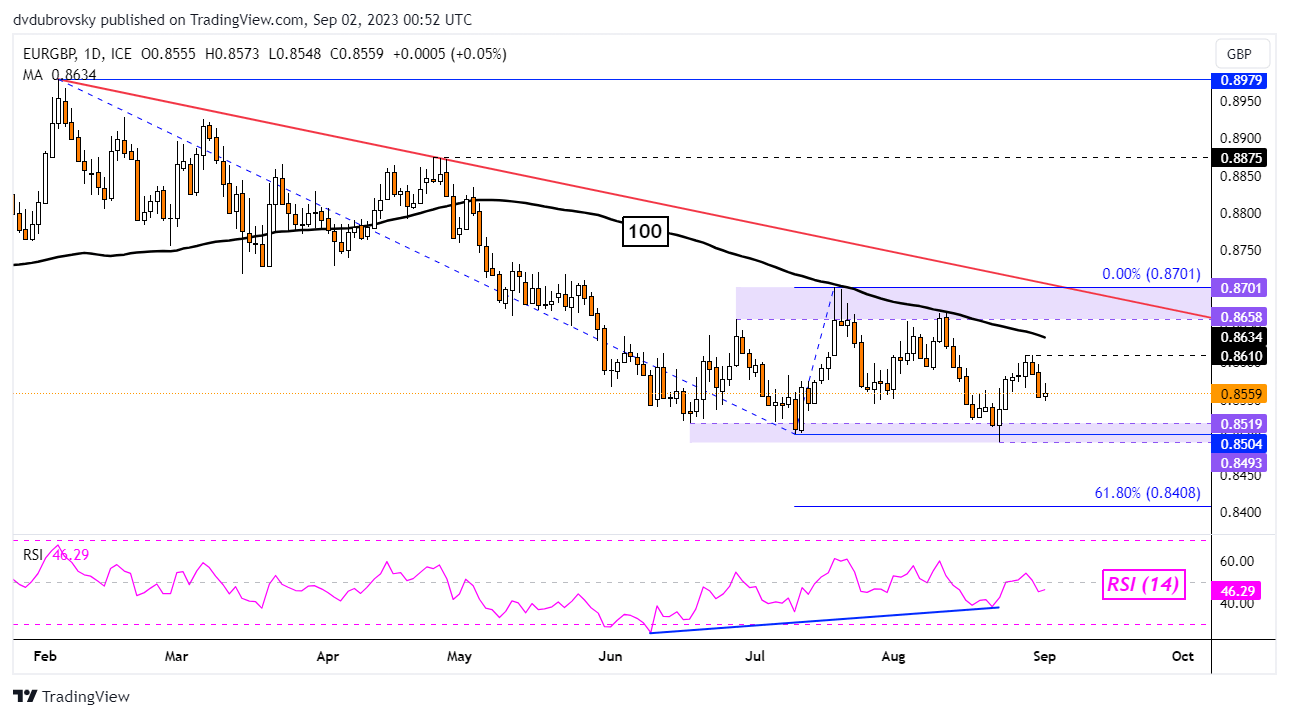
Meanwhile, the British Pound remains in a fairly neutral setting against the Euro. On the daily chart below, EUR/GBP has been consolidating since June between key zones of support and resistance.
Resistance seems to be the 0.8658 – 0.8701 range with support around the 0.8493 – 0.8519 area. Last week, the exchange rate left behind new resistance around 0.8610, subsequently turning lower. That is placing the focus on the range of support, which could hold and send prices back higher.
In such an outcome, more focus will be placed on the 100-day Moving Average, which held on multiple occasions throughout July and August. It could reinstate the downside focus.
Recommended by Daniel Dubrovsky
The Fundamentals of Breakout Trading

Chart Created in TradingView
— Written by Daniel Dubrovsky, Senior Strategist for DailyFX.com


 آموزش مجازی مدیریت عالی و حرفه ای کسب و کار DBA


ارسال نظر شما
مجموع نظرات : 0 در انتظار بررسی : 0 انتشار یافته : 0