

British Pound, GBP/USD, Daily vs 4-Hour Setting – Technical Update:
- British Pound breakout takes a break after Hammer candlestick
- But, on the 4-hour timeframe, the near-term bearish bias is in play
- Will GBP/USD resume Descending Channel direction ahead?
Recommended by Daniel Dubrovsky
Get Your Free GBP Forecast
The British Pound has been stabilizing against the US Dollar in recent days. In this technical update, we will take a look at how the broader trend is meshing with the near-term trajectory to develop a cohesive picture of Sterling.
On the daily setting, GBP/USD has confirmed a breakout under the long-term rising trendline from the end of last year. However, recent price action has been somewhat undermining the descent.
A Hammer candlestick pattern was left behind on August 3rd. This can at times be a sign of a bottom, especially in trending markets. Since then, there has been cautious upside follow-through.
On top of this, prices were unable to pierce through the 100-day Moving Average (MA). The latter held as support, reinstating the upside technical bias. Now, GBP/USD is wedged between the 1.2848 inflection point as well as the late June low of 1.2594. Clearing the latter opens the door to reinstating the near-term downward technical bias.
Otherwise, extending gains may see prices revisit the July peak of 1.3141.
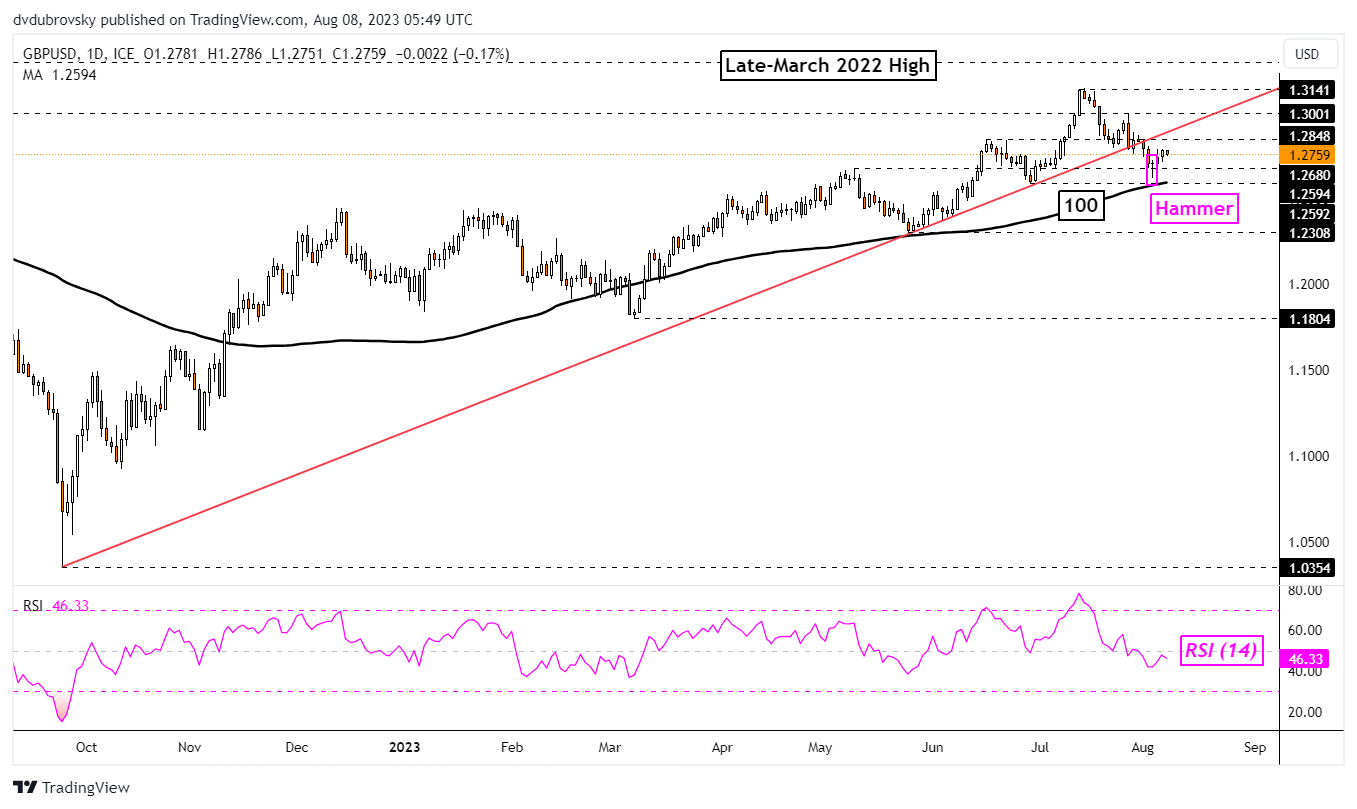
Chart Created in TradingView
A closer look at the 4-hour setting reveals that recent price action in the British Pound could be reflecting the downward trajectory since July. On this timeframe, it is easier to see a Descending Channel – see chart below.
On top of this, a bearish Death Cross is in play between the 50- and 100-period Moving Averages. Taken together, despite recent price action on the daily chart, the 4-hour setting argues that the downward trend since last month remains in play.
As such, it seems premature to conclude that the British Pound is reinstating the broader upside trajectory. On this timeframe, keep a close eye on the ceiling of the channel as well as the 23.6% Fibonacci retracement level of 1.2946.
Recommended by Daniel Dubrovsky
How to Trade GBP/USD
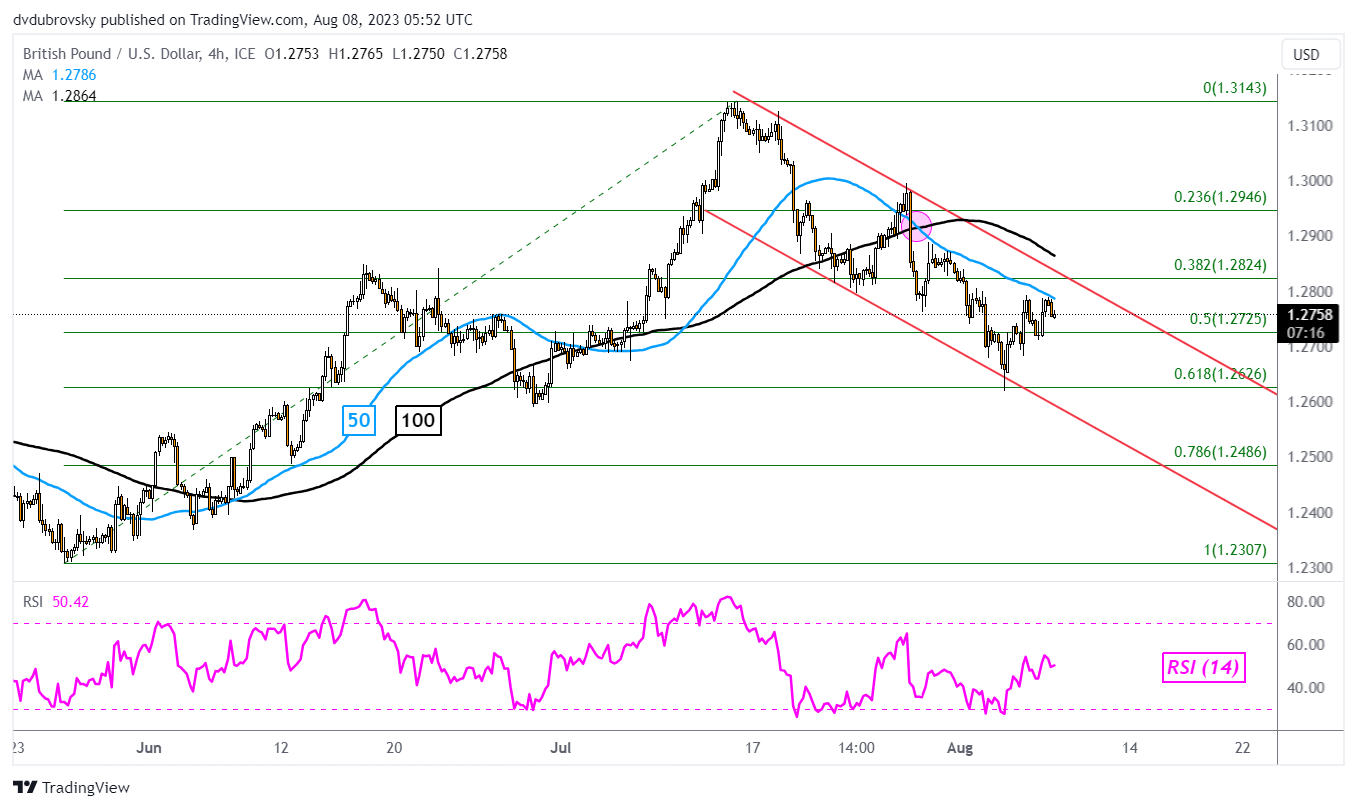
Chart Created in TradingView
— Written by Daniel Dubrovsky, Senior Strategist for DailyFX.com

 آموزش مجازی مدیریت عالی و حرفه ای کسب و کار DBA


ارسال نظر شما
مجموع نظرات : 0 در انتظار بررسی : 0 انتشار یافته : 0