

GBP/USD OUTLOOK:
- GBP/USD has been trending lower over the past three months or so
- After recent price action, cable appears compressed between trendline resistance and Fibonacci support
- This article presents important technical levels worth watching in the coming days
Trade Smarter – Sign up for the DailyFX Newsletter
Receive timely and compelling market commentary from the DailyFX team
Subscribe to Newsletter
Most Read: US Dollar Forecast – EUR/USD, AUD/USD on Shaky Ground. What Now?
The British pound has been losing ground against the U.S. dollar since mid-July, with GBP/USD following a well-defined downtrend line and establishing impeccable higher lows and lower lows along its bearish trajectory, as shown on the daily chart below.
Earlier in the week, cable made a push towards trendline resistance at 1.2275, but was swiftly rebuffed, reversing its course to the downside. This pullback suggests that sellers still have the upper hand in the market, as the greenback continues to ride a wave of bullish momentum in the broader FX space given elevated U.S. bond yields.
Following its recent setback, GBP/USD is sitting above a critical support area near 1.2075, where the 38.2% Fibonacci retracement of the 2022/2023 rally aligns with several swing lows. It is imperative that this floor holds at all costs – any failure to do so may catalyze a slump towards the 1.1800 handle.
In the event that prices bottom out and then start to rebound off current levels, dynamic resistance looms at 1.2225. Successfully piloting above this technical barrier could rekindle upward impetus, creating the right conditions for a move toward 1.2330. On further strength, the focus shifts to 1.2450, near the 200-day simple moving average.
Curious to learn how retail positioning can shape the short-term trajectory of GBP/USD? Our sentiment guide has all the relevant information you need. Grab a free copy now!
| Change in | Longs | Shorts | OI |
| Daily | -2% | 4% | 0% |
| Weekly | 3% | -7% | 0% |
GBP/USD TECHNICAL CHART
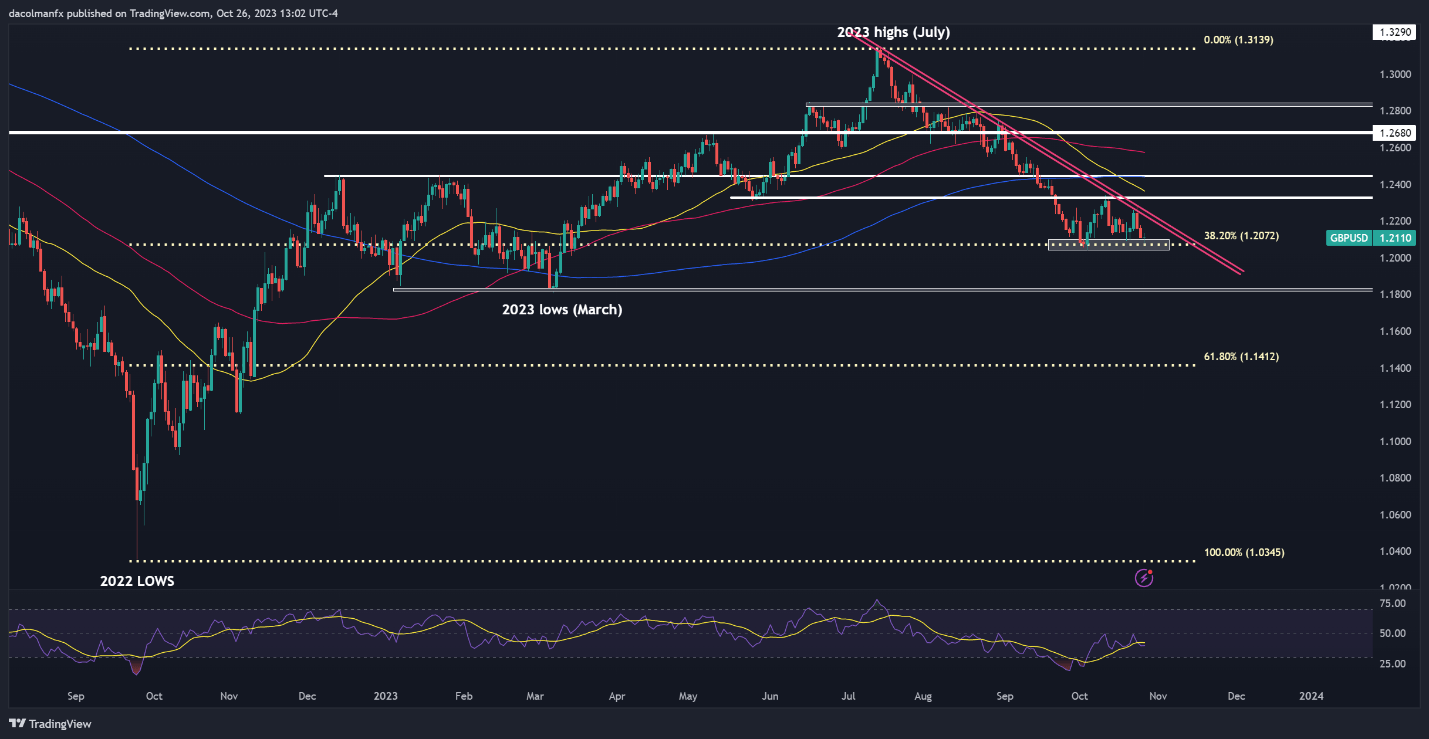
GBP/USD Chart Prepared Using TradingView
For a complete overview of the British pound’s technical and fundamental outlook in the coming months, make sure to grab your complimentary Q4 trading forecast now!
Recommended by Diego Colman
Get Your Free GBP Forecast

 آموزش مجازی مدیریت عالی و حرفه ای کسب و کار DBA


ارسال نظر شما
مجموع نظرات : 0 در انتظار بررسی : 0 انتشار یافته : 0