GBP/USD Analysis and Charts
- Better than expected PMI data underpins Sterling’s recent rally.
- Cable (GBP/USD) prints a fresh 10-week high.
For all market-moving economic data and events, see the DailyFX Calendar
The latest UK S&P Global PMIs beat both last month’s prints and expectations earlier today, with the all-important services sector leading the way.
Learn How to Trade Financial News with our Complimentary Guide
Recommended by Nick Cawley
Trading Forex News: The Strategy
According to Tim Moore, economics director at data provider S&P Global Market Intelligence,
‘The UK economy found its feet again in November as the service sector arrested a three-month sequence of decline and manufacturers began to report less severe cutbacks to production schedules. Relief at the pause in interest rate hikes and a clear slowdown in headline measures of inflation are helping to support business activity, although the latest survey data merely suggests broadly flat UK GDP in the final quarter of 2023.’
S&P Global Full Report
While the data shows a mildly better UK economy, albeit with worries about growth and inflation in the coming months, Sterling traders took a positive view on the release and pushed the Pound higher. GBP/USD made a new ten-week high post-release and the pair are now four-and-a-half big figures higher from the 1.2100 print seen at the start of the month. A lot of the move in cable has been due to US dollar weakness, but today’s rally is being led by Sterling’s strength and this may well continue.
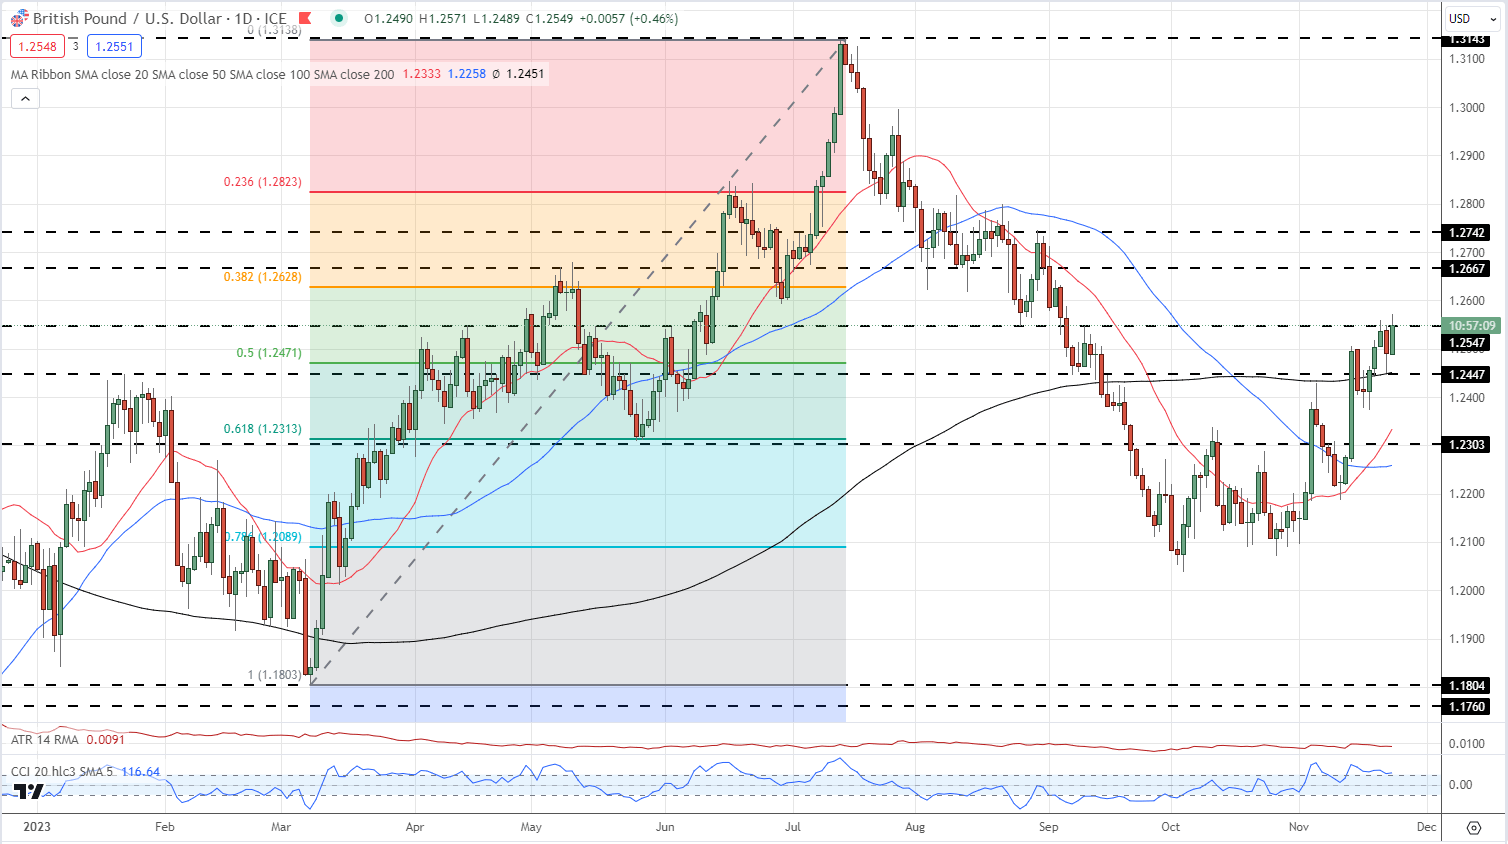
From a technical perspective, GBP/USD remains biased to further upside. The pair recently broke above the 200-day simple moving average (sma) for the first time since early September and this longer-dated moving average now turns supportive. Above the 200-dsma, the 50% Fibonacci retracement at 1.2471 adds further support. A clean break above 1.2547 would leave the 38.2% Fib retracement at 1.2628 vulnerable.
Recommended by Nick Cawley
How to Trade GBP/USD
GBP/USD Daily Price Chart

Retail trader data shows 52.97% of traders are net-long with the ratio of traders long to short at 1.13 to 1.The number of traders net-long is 2.78% higher than yesterday and 1.60% lower than last week, while the number of traders net-short is 11.97% lower than yesterday and 5.62% higher from last week.
What Does Retail Sentiment Mean for Price Action?
| Change in | Longs | Shorts | OI |
| Daily | 0% | -8% | -4% |
| Weekly | -10% | 14% | 0% |
Charts using TradingView
What is your view on the British Pound – bullish or bearish?? You can let us know via the form at the end of this piece or you can contact the author via Twitter @nickcawley1.


 آموزش مجازی مدیریت عالی و حرفه ای کسب و کار DBA


ارسال نظر شما
مجموع نظرات : 0 در انتظار بررسی : 0 انتشار یافته : ۰