Article by IG Chief Market Analyst Chris Beauchamp
FTSE 100, DAX 40, Nasdaq 100 Analysis and Charts
FTSE 100 drops sharply
Friday’s losses have continued into a new week, with the index testing 7500 in early trading this morning. After failing to hold above 7600, a new bearish view appears to prevail. This will be cemented with a close below 7450 that might then see the price head lower, towards the lows of early July around 7250. Hopes of a break higher have been dashed for now.
It would need a move back above 7600 to suggest that the buyers are regaining control.
Learn How to Avoid Common Trading Mistakes – Download the Guide Below
Recommended by IG
Top Trading Lessons
FTSE 100 Daily Price Chart
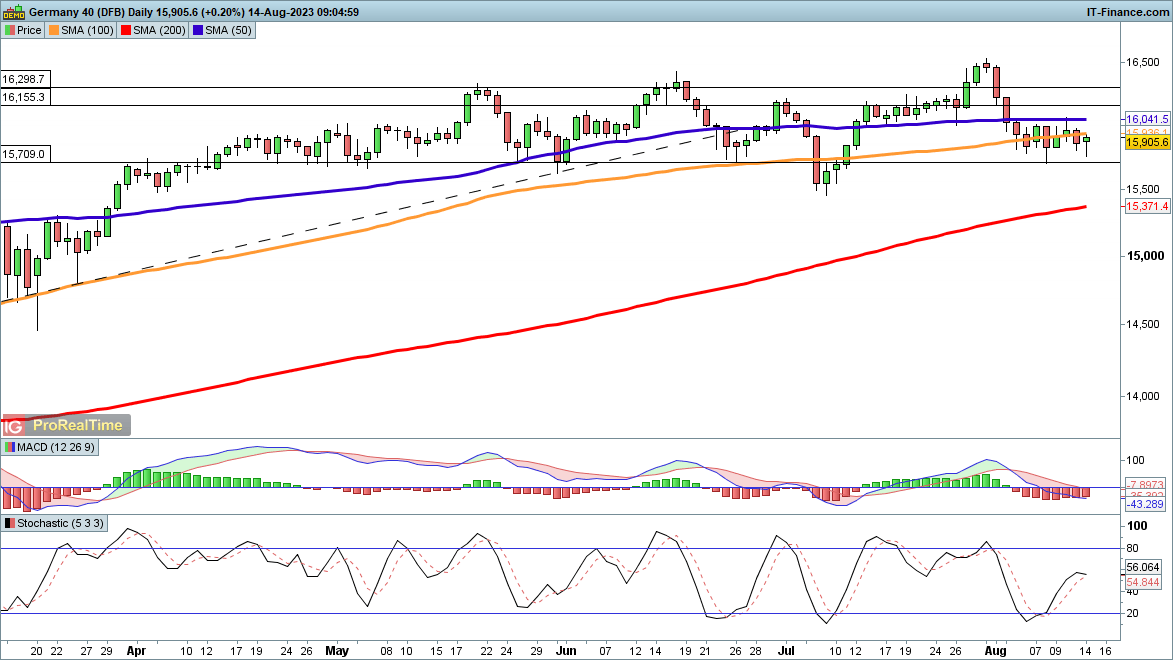
DAX 40 still holding above 15,700
Losses have been stemmed at 15,700 over the past week, leaving bulls hopeful that the recent pullback can be halted and turned into a new move higher. A close back above the 50-day SMA is still needed for the buyers to reassert control. This then allows the price to contemplate a move back to 16,500, the high from the end of July.
The consolidation looks likely to resolve into a move higher unless sellers can achieve a daily close below 15,700, and then below 15,500.
DAX 40 Daily Price Chart

IG Client Sentiment Shows Daily and Weekly Changes in Client Positioning
| Change in | Longs | Shorts | OI |
| Daily | 10% | 18% | 15% |
| Weekly | -8% | 2% | -2% |
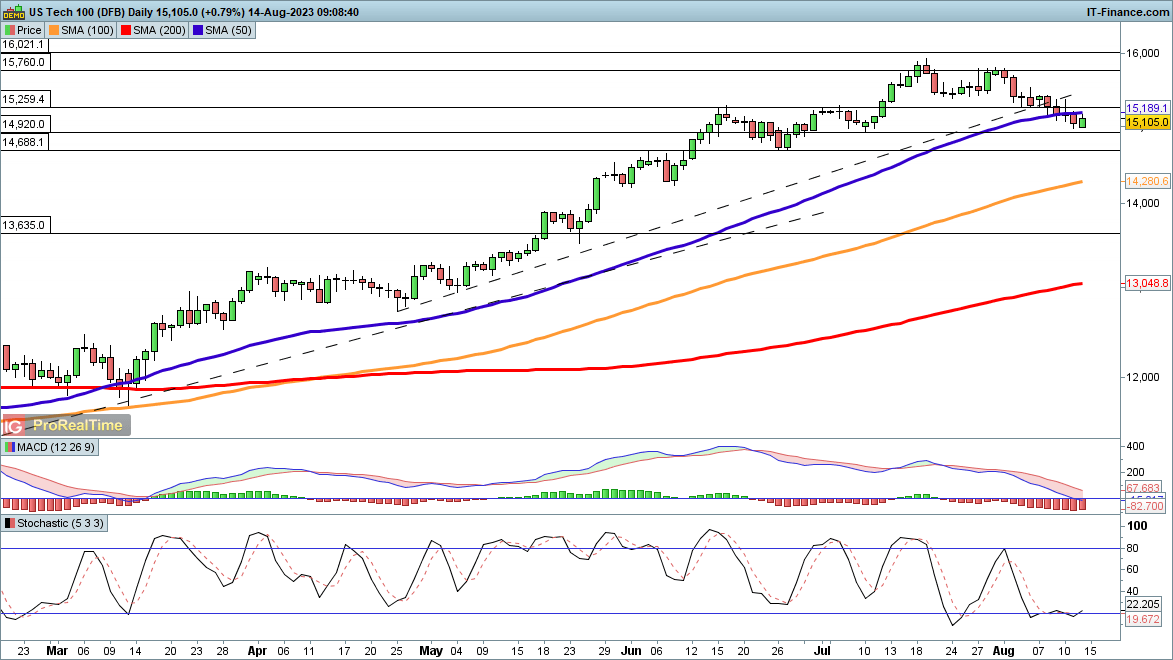
Nasdaq 100 buyers attempt to put in a floor
After pulling back over the past two weeks, the indexhas begun the week below the 50-day SMA, though it has edged higher in early trading.A close back above 15,260 might suggest that a higher low is in place and that a move back to the highs of July could now develop. This might then open the way to more gains, with the Q4 2021 record highs at 16,630 the next big level to watch.
Alternately, a close below 14,920 support would be a bearish development and bring the late June lows at 14,690 into view.
Nasdaq 100 Daily Price Chart

Foundational Trading Knowledge
Trading Discipline
Recommended by IG


 آموزش مجازی مدیریت عالی و حرفه ای کسب و کار DBA


ارسال نظر شما
مجموع نظرات : 0 در انتظار بررسی : 0 انتشار یافته : ۰