

Article by IG Chief Market Analyst Chris Beauchamp
FTSE 100, DAX 40, and Dow Jones 30 Charts and Analysis
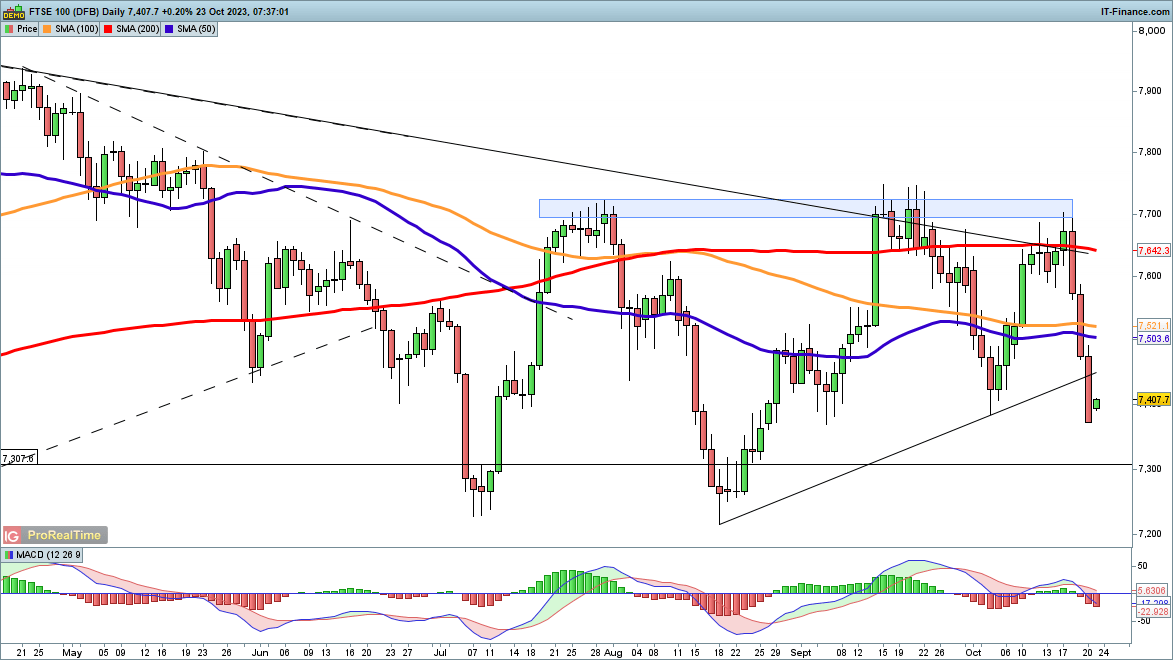
FTSE 100 back to 7400
Friday witnessed the index close below trendline support from the August low and below the early October low.Further losses now beckon towards 7300 and then down to 7215, the low from mid-August. Sellers have been firmly in control here over the previous three sessions after the index fell back from the 7700 zone for the third time since the second half of July.
Recent weakness has seen some buying emerge around 7370, with a close back above 7400 providing some hope that a short-term low has formed.
FTSE 100 Daily Chart
| Change in | Longs | Shorts | OI |
| Daily | 8% | 11% | 9% |
| Weekly | 116% | -52% | 7% |
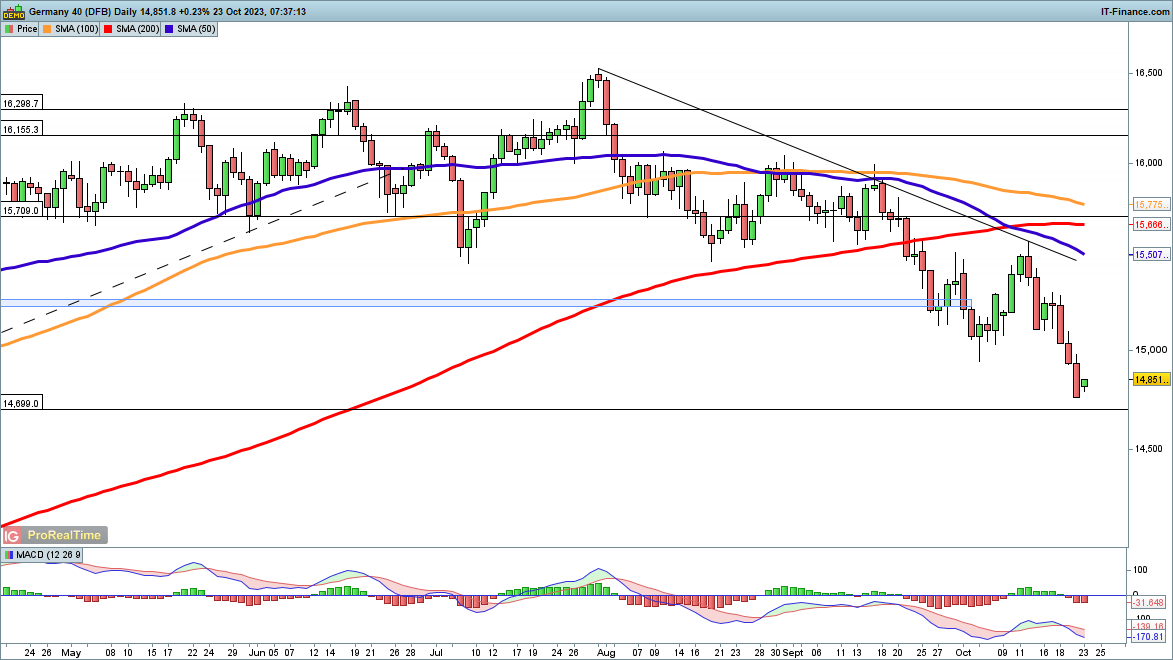
DAX 40 sits at seven-month lows
The losses of the past two weeks have finally seen the index head back towards its March lows, wiping out all the gains made since the banking crisis.The past two months have seen the index reach new lower highs and lower lows. This leaves the near-term bearish view intact.
In the short-term, the index would need to rebound above 15,500 to suggest that a low has formed and that a new attempt to clear post-July trendline resistance is underway.
DAX 40 Daily Chart
Recommended by IG
Get Your Free Equities Forecast
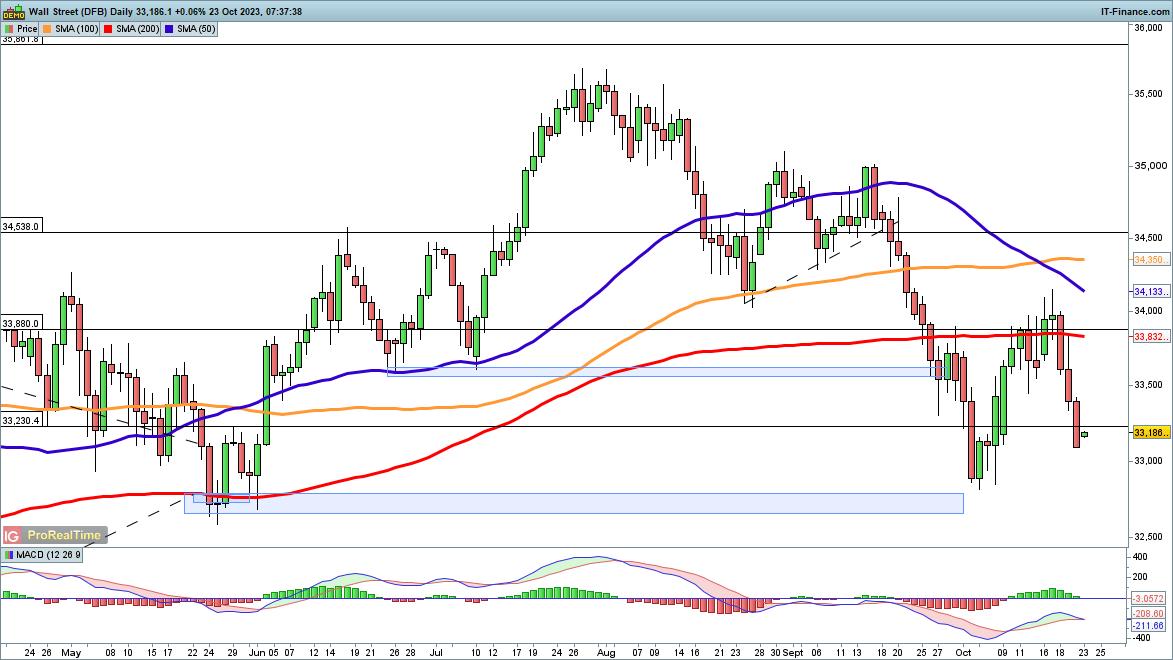
Dow Jones losses pause for now
The second half of last week witnessed the index lose 1000 points, and a move back to the early October low seems likely. Below this, the May low of around 32,500 comes into view as possible support. Further declines then see the index target the March lows below 32,500.
In the short-term, a close back above 33,500 might suggest that a low has been formed for the time being.
Dow Jones Daily Chart

 آموزش مجازی مدیریت عالی و حرفه ای کسب و کار DBA


ارسال نظر شما
مجموع نظرات : 0 در انتظار بررسی : 0 انتشار یافته : 0