
FTSE 100, DAX 40 and S&P 500 Try to Stabilize Ahead of FOMC Meeting
[ad_1] Article by IG Senior Market Analyst Axel Rudolph FTSE 100, DAX 40, S&P 500 Analysis and Charts FTSE 100 rises as UK inflation diminishes The FTSE 100 bounced off its 200-day simple moving average (SMA) at 7,643 as UK consumer price inflation (CPI) for August came in at a better-than-expected 6.7% year-on-year (YoY) versus

[ad_1]
Article by IG Senior Market Analyst Axel Rudolph
FTSE 100, DAX 40, S&P 500 Analysis and Charts
FTSE 100 rises as UK inflation diminishes
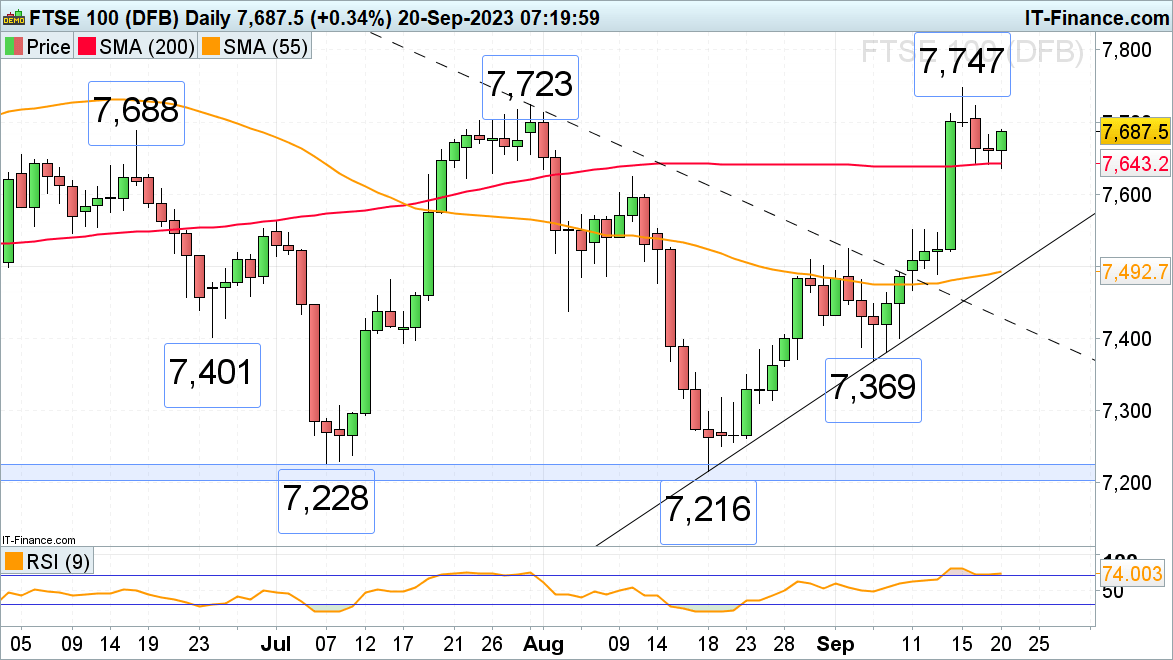
The FTSE 100 bounced off its 200-day simple moving average (SMA) at 7,643 as UK consumer price inflation (CPI) for August came in at a better-than-expected 6.7% year-on-year (YoY) versus an expected 7.0% and 6.8% in July. Core inflation dropped to 6.2% YoY versus 6.9% in July and an expected 6.8%.
Potential upside targets are the 7,723 July peak and at last week’s 7,747 high ahead of Thursday’s Bank of England rate decision where another 25 basis-point rate hike may still be on the cards. If these highs were to be exceeded, the psychological 7,800 mark and the 7,817 8 May high could be in focus.
A fall through Wednesday morning’s 7,636 low would engage the 10 August high at 7,624 and perhaps also the early July high at 7,562.
FTSE 100 Daily Chart
See the Latest Daily and Weekly Changes in FTSE Sentiment
| Change in | Longs | Shorts | OI |
| Daily | -2% | 4% | 2% |
| Weekly | -34% | 52% | 7% |
DAX 40 continues to range trade
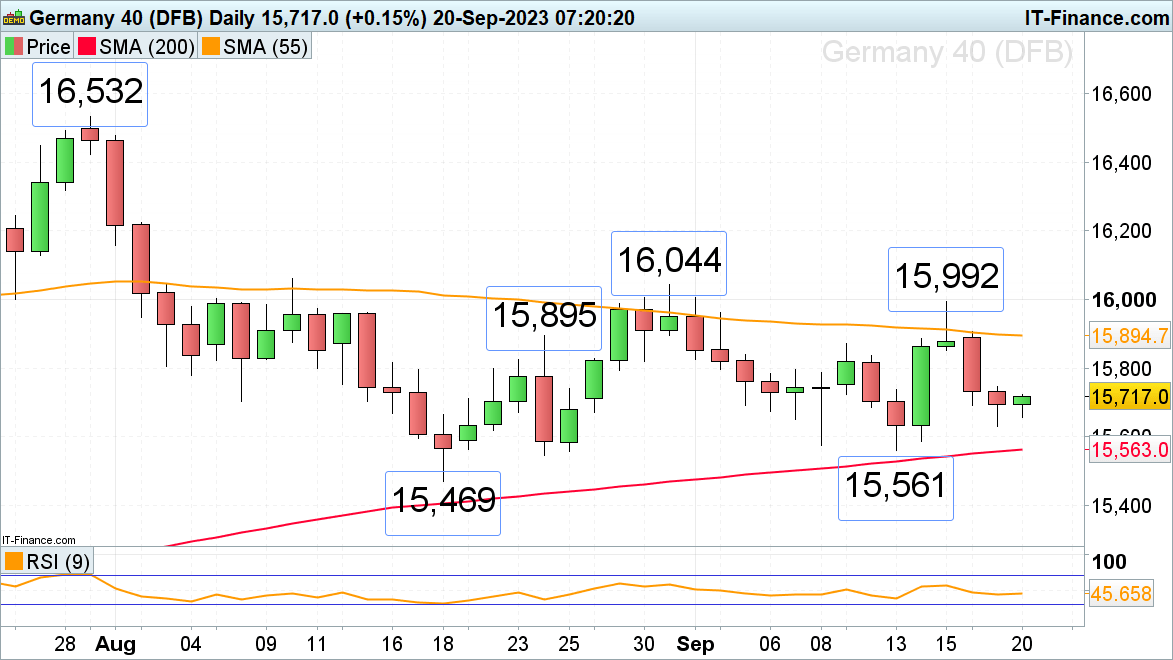
The DAX 40 is trying to stabilize ahead of today’s US Federal Reserve (Fed) rate decision despite German producer prices (PPI) coming in at a higher-than-expected 0.3% month-on-month (mom) in September versus a forecast 0.1% and -1.1% in August.
Minor resistance sits at the 7 September high at 15,797 and further resistance can be spotted at the 15,871 11 September peak. Below Tuesday’s low at 15,629 meanders the 200-day simple moving average (SMA) at 15,563 and lies last week’s low at 15,561.
DAX 40 Daily Chart
Recommended by IG
Top Trading Lessons
Risk-off for S&P 500 ahead of FOMC
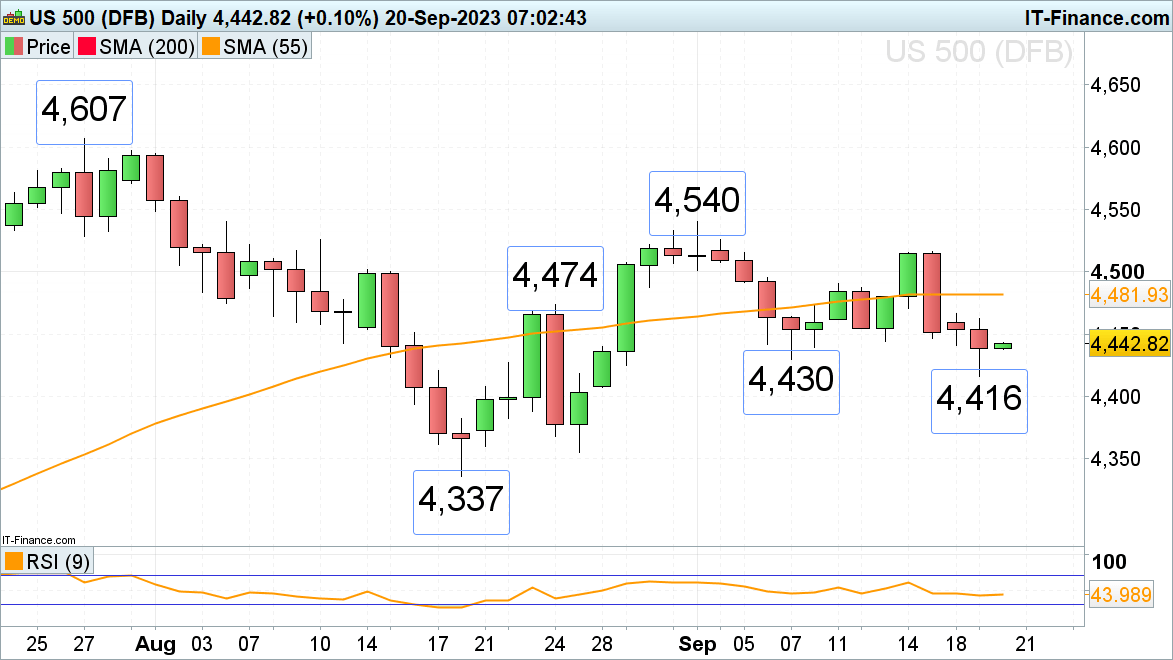
Following last Friday’s Bearish Engulfing pattern on the daily candlestick chart the S&P 500 slid for three consecutive days ahead of today’s Federal Open Market Committee (FOMC) at which no rate hike is expected.Future economic projections will take center stage, though, to see whether rates will have to remain higher for longer given resurging inflationary pressures such as the swift rise in the oil price.
As long as Tuesday’s low at 4,416 holds, a rise back towards the 4,474 to 4,482 24 August high and 55-day simple moving average (SMA) may unfold. Only a currently unexpected bullish reversal and advance above last week’s high at 4,516 would put the bulls back in control, though.
Failure at 4,416 would open the way for the 4,378 July low.
S&P 500 Daily Chart
Trade Smarter – Sign up for the DailyFX Newsletter
Receive timely and compelling market commentary from the DailyFX team
Subscribe to Newsletter
[ad_2]
لینک منبع : هوشمند نیوز
 آموزش مجازی مدیریت عالی حرفه ای کسب و کار Post DBA آموزش مجازی مدیریت عالی حرفه ای کسب و کار Post DBA+ مدرک معتبر قابل ترجمه رسمی با مهر دادگستری و وزارت امور خارجه |  آموزش مجازی مدیریت عالی و حرفه ای کسب و کار DBA آموزش مجازی مدیریت عالی و حرفه ای کسب و کار DBA+ مدرک معتبر قابل ترجمه رسمی با مهر دادگستری و وزارت امور خارجه |  آموزش مجازی مدیریت کسب و کار MBA آموزش مجازی مدیریت کسب و کار MBA+ مدرک معتبر قابل ترجمه رسمی با مهر دادگستری و وزارت امور خارجه |
 مدیریت حرفه ای کافی شاپ |  حقوقدان خبره |  سرآشپز حرفه ای |
 آموزش مجازی تعمیرات موبایل آموزش مجازی تعمیرات موبایل |  آموزش مجازی ICDL مهارت های رایانه کار درجه یک و دو |  آموزش مجازی کارشناس معاملات املاک_ مشاور املاک آموزش مجازی کارشناس معاملات املاک_ مشاور املاک |
- نظرات ارسال شده توسط شما، پس از تایید توسط مدیران سایت منتشر خواهد شد.
- نظراتی که حاوی تهمت یا افترا باشد منتشر نخواهد شد.
- نظراتی که به غیر از زبان فارسی یا غیر مرتبط با خبر باشد منتشر نخواهد شد.


ارسال نظر شما
مجموع نظرات : 0 در انتظار بررسی : 0 انتشار یافته : 0