FTSE 100, DAX 40 and S&P 500 Lose Upside Momentum Following Last Week’s Strong Gains
Article by IG Senior Market Analyst Axel Rudolph FTSE 100, DAX 40, S&P 500 Analysis and Charts FTSE 100 hovers above support The FTSE 100 ended last week on a high and managed to rally to 7,484, close to the 55-day simple moving average (SMA) at 7,497, following softer US employment data, rapidly falling yields

Article by IG Senior Market Analyst Axel Rudolph
FTSE 100, DAX 40, S&P 500 Analysis and Charts
FTSE 100 hovers above support
The FTSE 100 ended last week on a high and managed to rally to 7,484, close to the 55-day simple moving average (SMA) at 7,497, following softer US employment data, rapidly falling yields and rising US indices. The index begins this week around the 7,401 June low and the early September and early October lows at 7,384 to 7,369 which offer minor support. While it holds, last week’s high at 7,484 may be revisited, together with the 55-day simple moving average at 7,497 and the early September high at 7,524. If overcome in the course of this week, the 200-day simple moving average (SMA) at 7,621 would be next in line.
Below 7,384 lies the October low at 7,258 which was made close to the 7,228 to 7,204 March-to-August lows and as such major support zone.
FTSE 100 Daily Chart
Download our Free Q4 Equities Guide Here:
Recommended by IG
Get Your Free Equities Forecast
DAX 40 loses upside momentum ahead of resistance
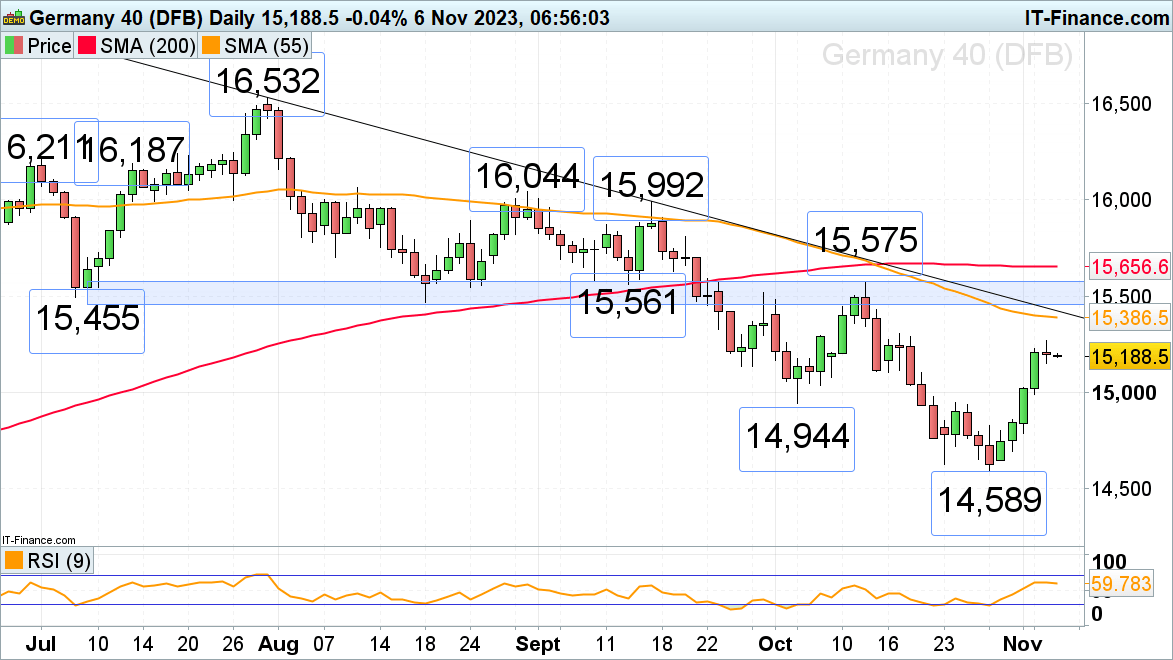
The DAX 40’s rally from its 14,589 October low has been followed by one of this year’s strongest weekly rallies amid a dovish Federal Reserve (Fed) outlook and softer US employment data. A rise above Friday’s 15,368 high will put the 55-day simple moving average (SMA) and the July-to-November downtrend line at 15,386 to 15,420 on the map. Slightly above it sits major resistance between the 15,455 to 15,575 July-to-mid-September lows and the mid-October high.
Slips should find support around the 15,104 mid-October low below which lies the minor psychological 15,000 mark and the early October low at 14,944.
DAX40 Daily Chart

See How IG Client Sentiment Can Affect Price Forecasts
| Change in | Longs | Shorts | OI |
| Daily | 21% | 10% | 15% |
| Weekly | -25% | 51% | 3% |
S&P 500 futures point to higher open after several dismal weeks
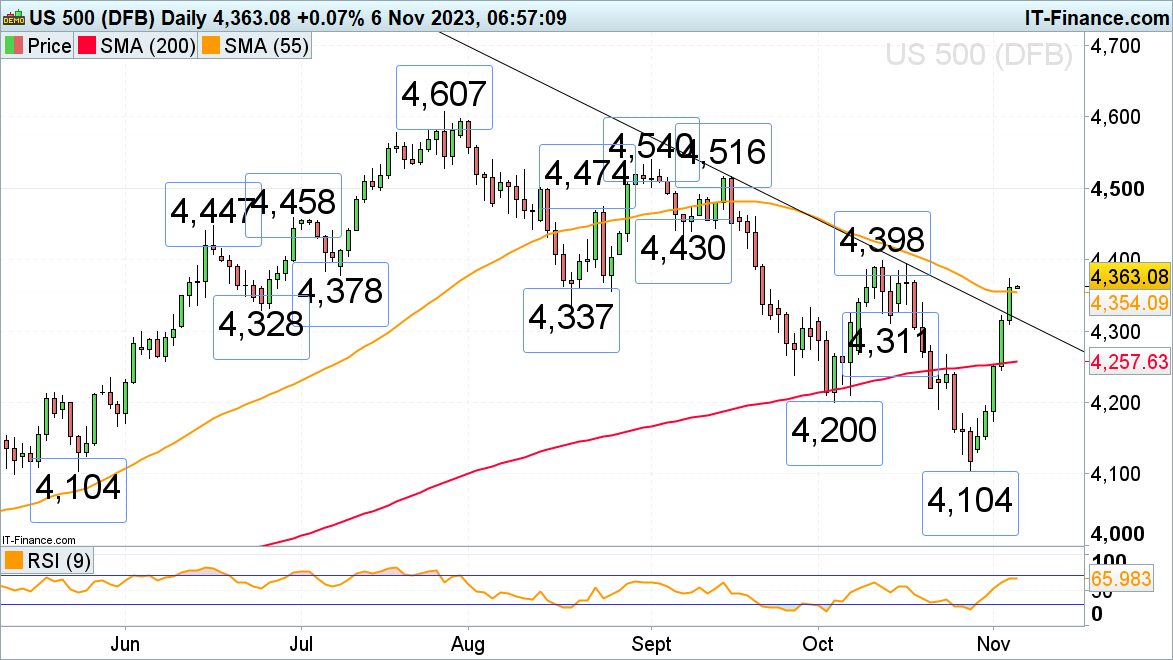
Last week the S&P 500 saw its strongest weekly year-to-date gain thanks to softer economic data, and a subdued non-farm payroll report. These led market participants to believe that the Fed has ended its rate hike cycle and that the US economy remains on track for a soft landing. The next upside target is the October high at 4,398 which needs to be exceeded on a daily chart closing basis for a technical bottoming formation to be confirmed. If so, an advance towards the September peak at 4,540 may be seen into year-end.
Minor support below the 55-day simple moving average (SMA) at 4,354 can be spotted around the 4,337 August low and the breached September-to-November downtrend line, now because of inverse polarity a support line, at 4,315 as well as at the 4,311 mid-October low.
S&P 500 Daily Chart

Recommended by IG
Get Your Free Top Trading Opportunities Forecast
 آموزش مجازی مدیریت عالی حرفه ای کسب و کار Post DBA آموزش مجازی مدیریت عالی حرفه ای کسب و کار Post DBA+ مدرک معتبر قابل ترجمه رسمی با مهر دادگستری و وزارت امور خارجه |  آموزش مجازی مدیریت عالی و حرفه ای کسب و کار DBA آموزش مجازی مدیریت عالی و حرفه ای کسب و کار DBA+ مدرک معتبر قابل ترجمه رسمی با مهر دادگستری و وزارت امور خارجه |  آموزش مجازی مدیریت کسب و کار MBA آموزش مجازی مدیریت کسب و کار MBA+ مدرک معتبر قابل ترجمه رسمی با مهر دادگستری و وزارت امور خارجه |
 مدیریت حرفه ای کافی شاپ |  حقوقدان خبره |  سرآشپز حرفه ای |
 آموزش مجازی تعمیرات موبایل آموزش مجازی تعمیرات موبایل |  آموزش مجازی ICDL مهارت های رایانه کار درجه یک و دو |  آموزش مجازی کارشناس معاملات املاک_ مشاور املاک آموزش مجازی کارشناس معاملات املاک_ مشاور املاک |
- نظرات ارسال شده توسط شما، پس از تایید توسط مدیران سایت منتشر خواهد شد.
- نظراتی که حاوی تهمت یا افترا باشد منتشر نخواهد شد.
- نظراتی که به غیر از زبان فارسی یا غیر مرتبط با خبر باشد منتشر نخواهد شد.


ارسال نظر شما
مجموع نظرات : 0 در انتظار بررسی : 0 انتشار یافته : ۰