

Article by IG Chief Market Analyst Chris Beauchamp
Dow Jones, Nikkei 225, CAC 40 Analysis and Charts
Dow holds above trendline support
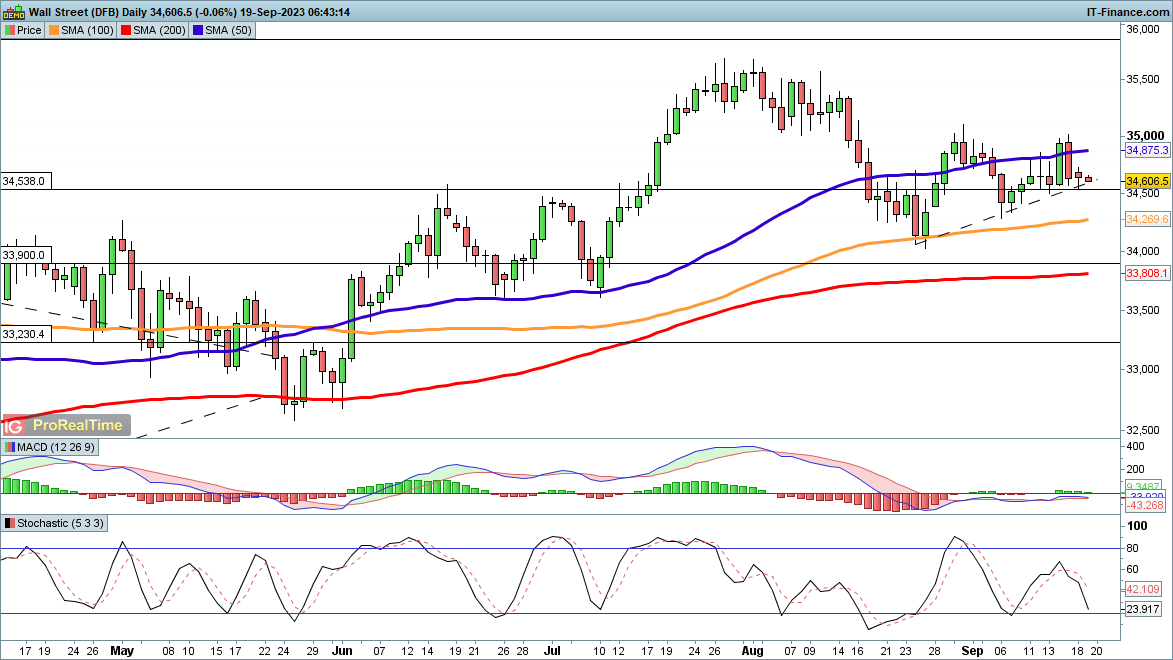
After Friday’s slump the index struggled to make much headway on Monday.The 35,000 level is the barrier to any short-term upside, beyond which the highs of August towards 35,800 loom. For the moment, trendline support from the August low continues to hold, propping up the index and preventing any near-term decline.
A close below 34,500 would be a bearish catalyst, and see the price test the early September low (34,330), then the 100-day SMA, and then the August low just above 34,000.
Dow Jones Daily Chart
See Daily and Weekly Dow Jones Sentiment Changes
| Change in | Longs | Shorts | OI |
| Daily | 7% | 4% | 5% |
| Weekly | -3% | -1% | -2% |
Nikkei 225 consolidates after recent surge
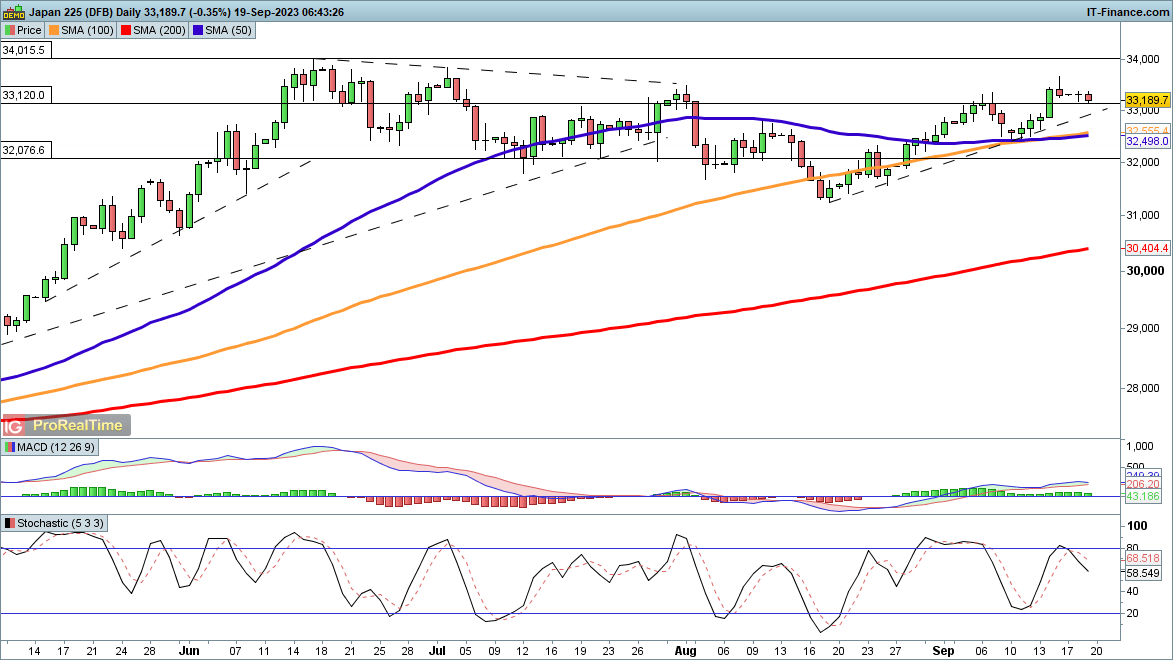
After surging on Thursday last week the index has seen a loss of momentum, though it has held on to most of those gains.As with the Dow, trendline support from the August low continues to underpin the index. It would need a close back below 33,000 to suggest that a bearish view prevails in the short term.
Further upside targets the June highs at 34,000, once the 33,500 level has been breached on a daily close basis.
Nikkei 225 Daily Chart
See How Top Traders Approach the Market
Recommended by IG
Traits of Successful Traders
CAC 40 fights to remain above 200-day MA
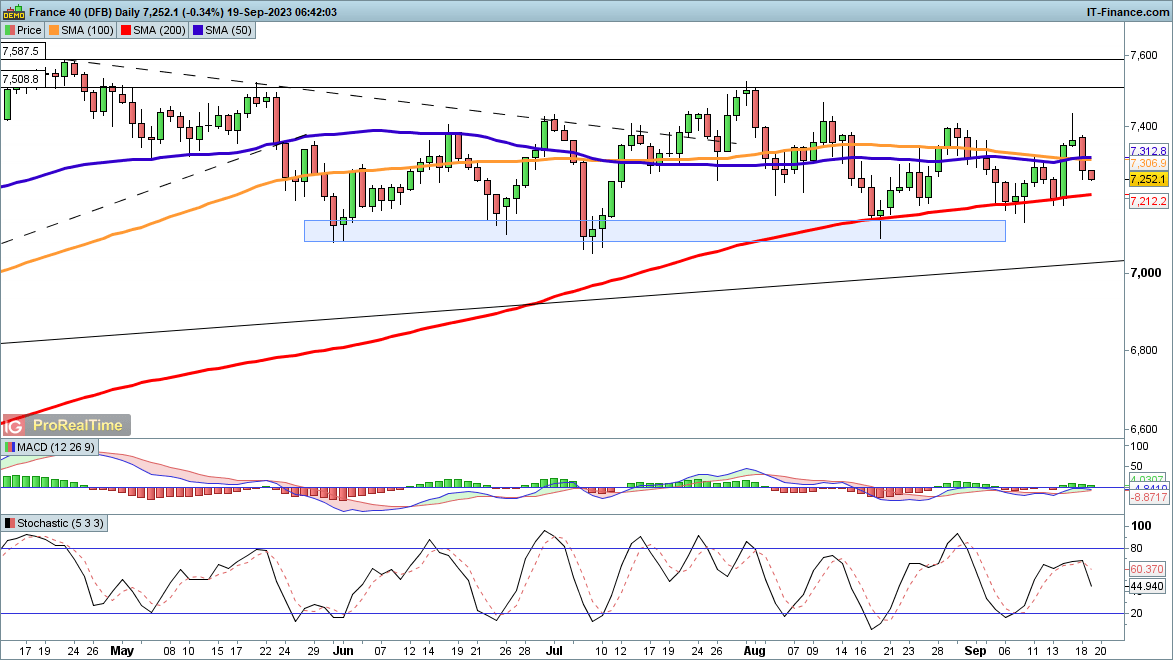
The CAC 40 suffered a severe loss of momentum on Monday, reversing from Friday’s 7400 high.Once more the index has seen bullish momentum fade, and a return to the 200-day SMA looks likely. This has stalled any deeper retracement since mid-August, while below this the 7100 support zone looms.
A close above 7400 would provide a much-needed bullish catalyst, and open the way to 7508 and 7587.
CAC 40 Daily Chart
Recommended by IG
Traits of Successful Traders

 آموزش مجازی مدیریت عالی و حرفه ای کسب و کار DBA


ارسال نظر شما
مجموع نظرات : 0 در انتظار بررسی : 0 انتشار یافته : 0