Article by IG Senior Market Analyst Chris Beauchamp
DAX 40, S&P 500, CAC 40 Analysis and Charts
Dax sees further strength
After rallying to the 50-day SMA earlier in the week, the index fell back yesterday as the euro strengthened and expectations of a fresh ECB rate hike in September rose. The bounce from last week’s lows and the 15,500 level now needs to push back above 16,000 in order to open the way to further upside. An initial target would be the late July highs at 16,500. Beyond this, the index would be in new record-high territory.
A reversal back below 15,700 could suggest that sellers will be able to engineer a retest of 15,500 or even the 200-day SMA.
DAX 40 Daily Chart
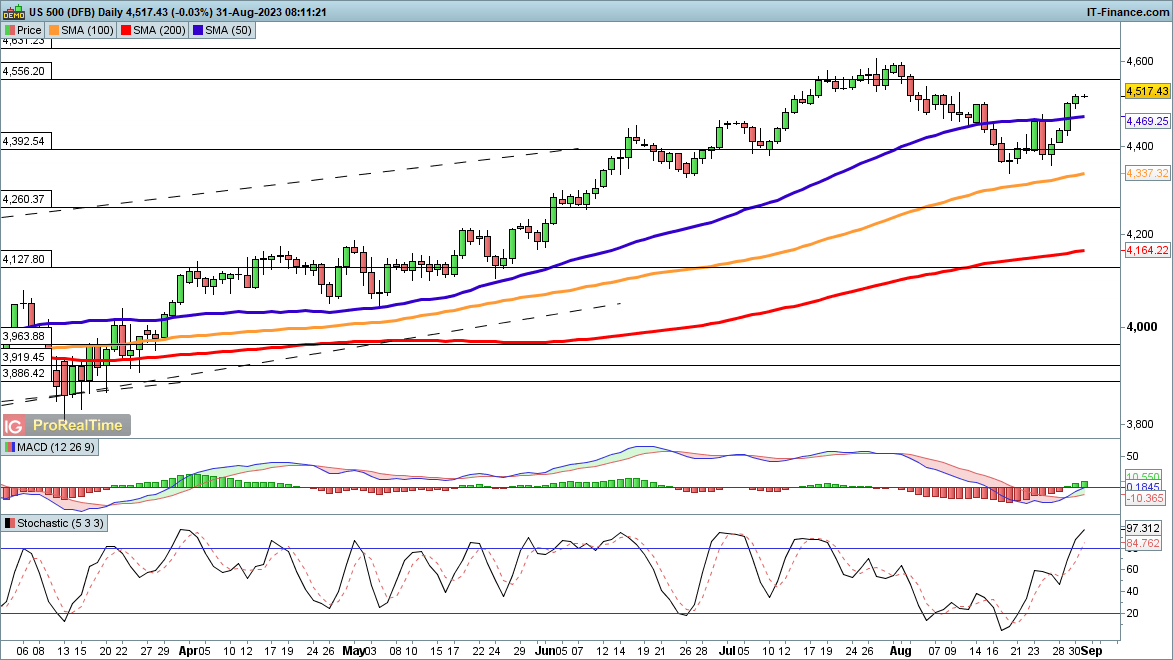
S&P 500 in rally mode into month-end
While Wednesday failed to match the solid gains of Tuesday, the additional upside did help to solidify the bullish move, with a higher low having been created over the past two weeks.Having seen the price close back above the 50-day SMA, the next target becomes the highs of July around 4600. The bullish view has been supported by the MACD crossover this week, the first since early July, a sign that momentum has shifted back to the buyers for the time being.
The buyers remain in control for now, and it would take a move back below 4400 to suggest that the recent low may be tested once more.
Trade Smarter – Sign up for the DailyFX Newsletter
Receive timely and compelling market commentary from the DailyFX team
Subscribe to Newsletter
S&P 500 Daily Chart

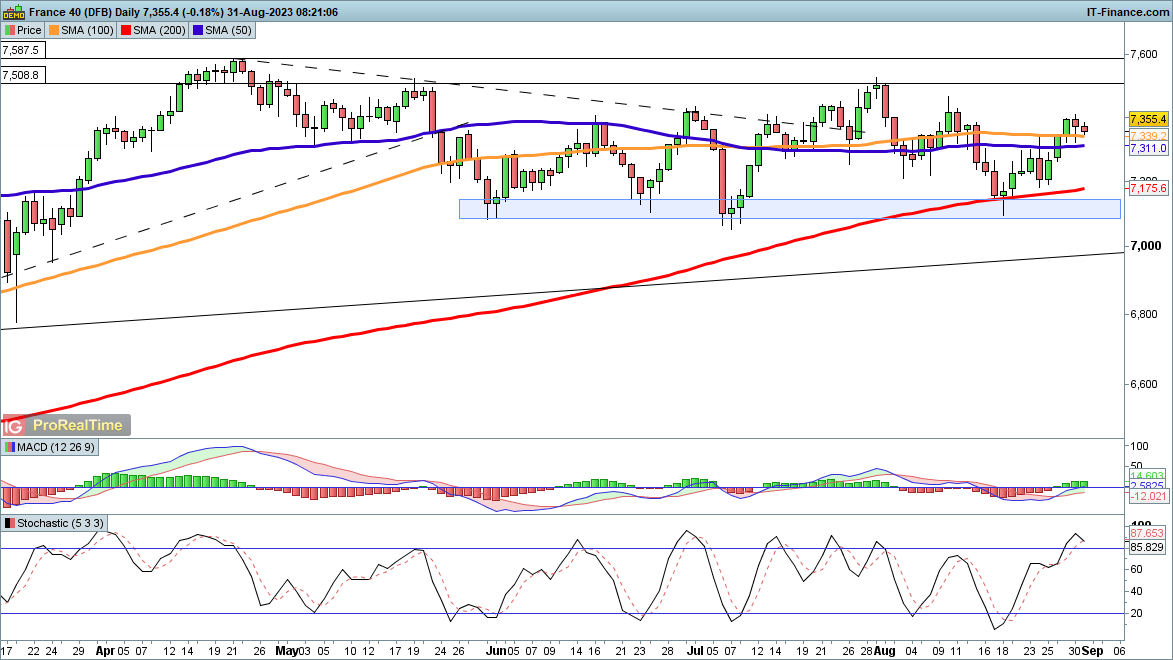
CAC40 edges up
After hitting a new record high in April the index has seen a more muted performance. However, repeated dips to 7100 found buyers, helping to stem any looming bearish view. The latest bounce from mid-August has seen the index rally from below the 200-day SMA, and then move on back above the 50- and 100-day SMAs. Further upside from here would see the index push into the 7500 area that stifled progress in late July and early August. Above this, the highs of April at 7587 come into view.
A close back below 7300 would weaken the bullish case, and suggest another test of the 200-day SMA is likely, along with the 7100 support zone.
Recommended by IG
Traits of Successful Traders
CAC 40 Daily Chart


 آموزش مجازی مدیریت عالی و حرفه ای کسب و کار DBA


ارسال نظر شما
مجموع نظرات : 0 در انتظار بررسی : 0 انتشار یافته : ۰