
Calm before the storm, as STI remains in range, AUD/USD struggles
[ad_1] Market Recap Recommended by Jun Rong Yeap How to Trade FX with Your Stock Trading Strategy Major US indices gave back all of last week’s gains on Friday, with volatility triggered by the triple witching day amid the vast options’ expiry (estimated to be $3.4 trillion worth – the largest September expiry on record).

[ad_1]
Market Recap
Recommended by Jun Rong Yeap
How to Trade FX with Your Stock Trading Strategy
Major US indices gave back all of last week’s gains on Friday, with volatility triggered by the triple witching day amid the vast options’ expiry (estimated to be $3.4 trillion worth – the largest September expiry on record). The VIX bounced 7.6% off its June 2023 bottom, while mega-cap tech stocks failed to provide any much-needed resilience. Nvidia and Meta were both down 3.7%, alongside Amazon -3% and Microsoft -2.5%.
A further move higher in US Treasury yields may account for some de-risking as well, with yields setting its sight to overcome its year-to-date high ahead of this week’s Federal Open Market Committee (FOMC) meeting. The US two-year yields were back above its 5% level, as market participants continue to adjust their expectations to accommodate for a high-for-longer rate outlook.
Economic data were largely mixed, with US August industrial production holding up better with a 0.4% month-on-month increase versus the 0.1% expected. But more attention seems to revolve around the weaker-than-expected consumer sentiment data (67.7 versus 69.1 consensus), which marked its second straight month of underperformance. The bright spot is that consumers’ inflation expectations continue to moderate, which may provide some room for the Fed to keep rates on hold for now.
The DJIA has been trading on higher lows since March this year, but are finding some resistance at the key 35,000 level for now. On the downside, an upward trendline support, along with its 100-day moving average (MA) and Ichimoku cloud on the daily chart, will serve as a key support confluence at the 34,400 level – a key level to defend from the bulls. On the other hand, any move above the 35,000 level may pave the way to retest its year-to-date high at the 35,600 level next.
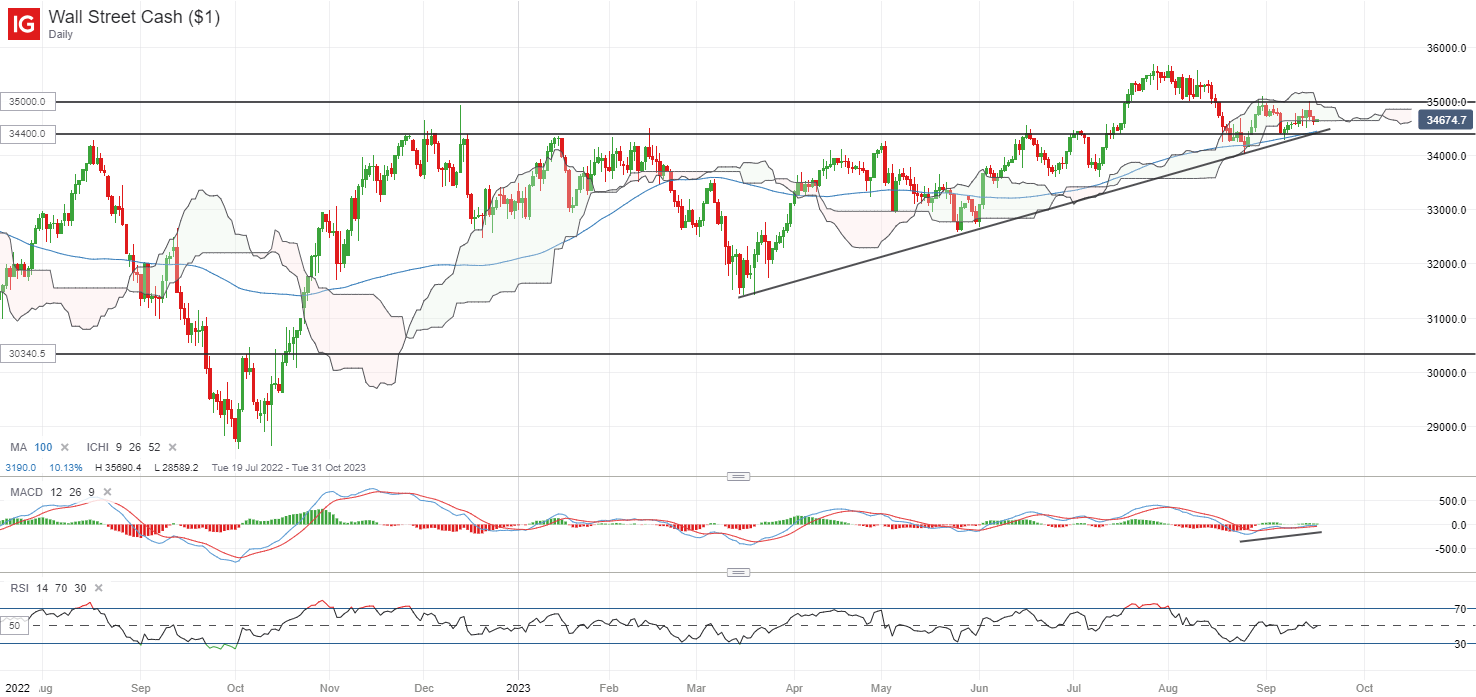
Source: IG charts
Asia Open
Asian stocks look set for a downbeat open, with ASX -0.58%, NZX -0.53% and KOSPI -0.47% at the time of writing. Japan markets are closed for Respect for the Aged Day. Sentiments seem to be treading on some ‘calm before the storm’ in the lead-up to a series of key central bank ‘live’ decisions this week. Chinese economic data has surprised to the upside last week, but that did not trigger much broad-based gains in Chinese equities with investors still finding for more follow-through in its recovery.
On the economic data front, Singapore’s non-oil exports for August turned in its 11th consecutive month of year-on-year contraction this morning, with a significant downside surprise providing testament to the still-weak global demand (-20.1% versus -15.8% forecast). Both the electronics (-21.1%) and non-electronics (-19.9%) segments declined, with double-digit trade moderation among our top trading partners (US -32.4%, EU -28.9%, China -16.4%) likely to suggest subdued growth through the rest of the year.
Singapore’s Straits Times Index (STI) has recovered close to 4.4% since its August 2023 bottom, validating a bounce off the lower range of its long-running consolidation pattern. Its relative strength index (RSI) has crossed back above its 50 level for the first time in more than a month, potentially pointing to some near-term upward momentum. The 3,350 level may be on watch next, which marked an immediate resistance to overcome ahead.
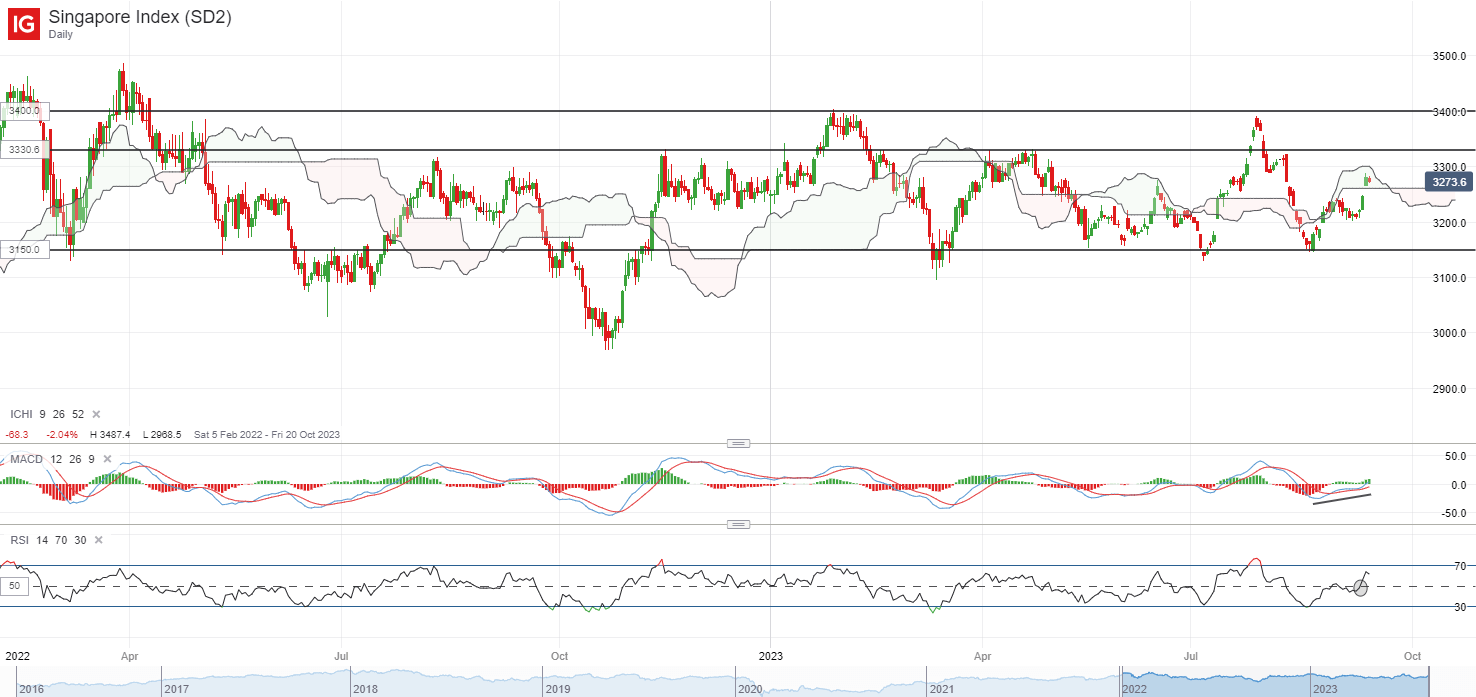
Source: IG charts
On the watchlist: Can AUD/USD regain its footing with RBA minutes release tomorrow?
Despite an attempt to bounce off its year-to-date low at the 0.636 level lately, sellers continue to exert some dominance for the AUD/USD, with the formation of a bearish pin bar on the daily chart last Friday rejecting the 0.649 level for now. Its daily RSI is also facing a key test, as it is back to retest its key 50 level, which it has failed to cross above since July this year.
Greater conviction for buyers may have to come from a move above the 0.649 level, which will mark a potential break above its current consolidation pattern. The RBA minutes release will be in focus tomorrow, which will be scrutinised for clues on whether the central bank will extend its rate pause for the fourth straight month ahead. Overcoming the 0.649 level for the AUD/USD may pave the way to retest its next resistance at the 0.660 level.
Recommended by Jun Rong Yeap
How to Trade AUD/USD
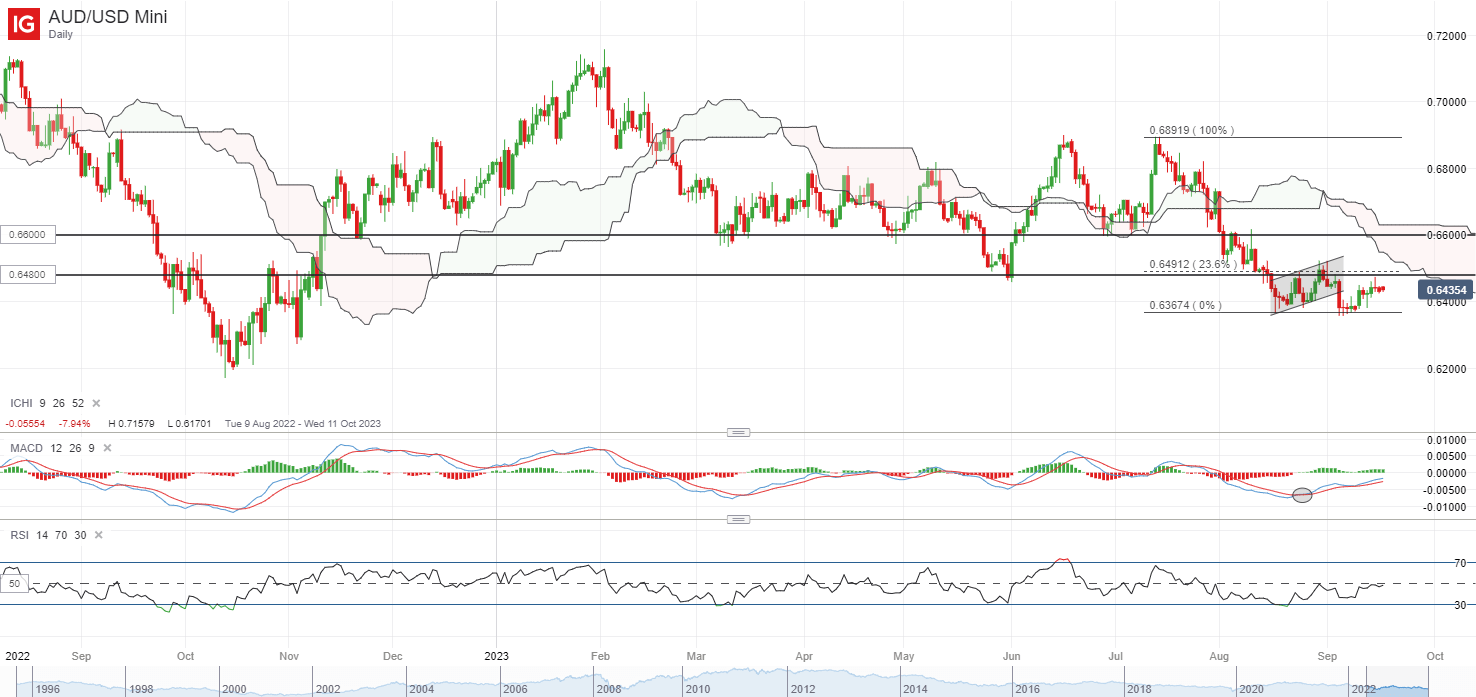
Source: IG charts
Friday: DJIA -0.83%; S&P 500 -1.22%; Nasdaq -1.56%, DAX +0.56%, FTSE +0.50%
Trade Smarter – Sign up for the DailyFX Newsletter
Receive timely and compelling market commentary from the DailyFX team
Subscribe to Newsletter
[ad_2]
لینک منبع : هوشمند نیوز
 آموزش مجازی مدیریت عالی حرفه ای کسب و کار Post DBA آموزش مجازی مدیریت عالی حرفه ای کسب و کار Post DBA+ مدرک معتبر قابل ترجمه رسمی با مهر دادگستری و وزارت امور خارجه |  آموزش مجازی مدیریت عالی و حرفه ای کسب و کار DBA آموزش مجازی مدیریت عالی و حرفه ای کسب و کار DBA+ مدرک معتبر قابل ترجمه رسمی با مهر دادگستری و وزارت امور خارجه |  آموزش مجازی مدیریت کسب و کار MBA آموزش مجازی مدیریت کسب و کار MBA+ مدرک معتبر قابل ترجمه رسمی با مهر دادگستری و وزارت امور خارجه |
 مدیریت حرفه ای کافی شاپ |  حقوقدان خبره |  سرآشپز حرفه ای |
 آموزش مجازی تعمیرات موبایل آموزش مجازی تعمیرات موبایل |  آموزش مجازی ICDL مهارت های رایانه کار درجه یک و دو |  آموزش مجازی کارشناس معاملات املاک_ مشاور املاک آموزش مجازی کارشناس معاملات املاک_ مشاور املاک |
- نظرات ارسال شده توسط شما، پس از تایید توسط مدیران سایت منتشر خواهد شد.
- نظراتی که حاوی تهمت یا افترا باشد منتشر نخواهد شد.
- نظراتی که به غیر از زبان فارسی یا غیر مرتبط با خبر باشد منتشر نخواهد شد.


ارسال نظر شما
مجموع نظرات : 0 در انتظار بررسی : 0 انتشار یافته : 0