USD/JPY ANALYSIS & TALKING POINTS
- Japanese inflation keeps pressure on BoJ to shift policy.
- Strong emphasis on US economic data that includes core PCE.
- Upside risks remain despite solid start to the week for the yen.
Supercharge your trading prowess with an in-depth analysis of the Japanese Yen outlook, offering insights from both fundamental and technical viewpoints. Claim your free Q4 trading guide now!
Recommended by Warren Venketas
Get Your Free JPY Forecast
JAPANESE YEN FUNDAMENTAL BACKDROP
The Japanese Yen ended the trading week on a muted tone due to the US Thanksgiving Day hangover but Friday held some key information to factor into the Bank of Japan’s (BOJ) analysis. Once again, headline inflation held above the 2% whilst beating estimates and remaining above 3%. Remember the BoJ consistently reinforces the fact that they want to see sustained +2% inflation thus increasing the likelihood of a policy shift. A hawkish move will aid the yen and conclude negative interest rates policy.
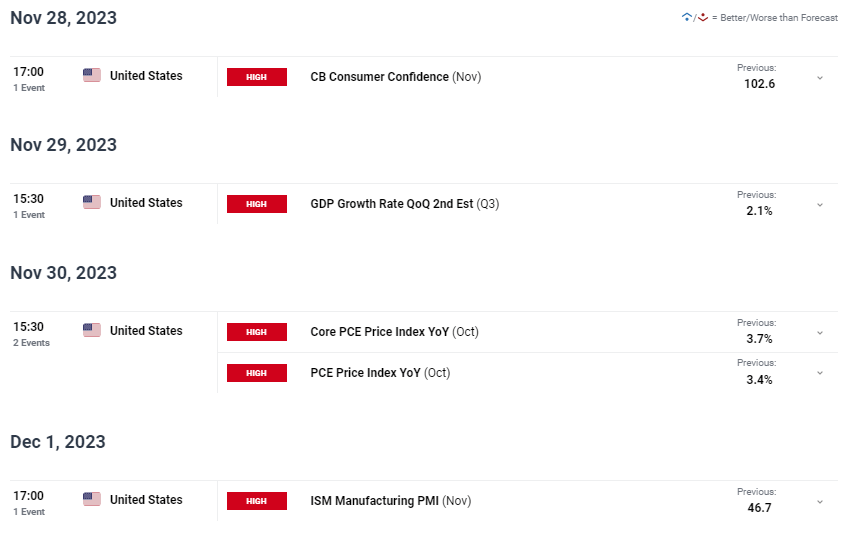
The Israel-Hamas war needs to be closely monitored as the JPY could find additional support should the situation escalate – safe haven demand. The week ahead (see economic calendar below) will be more focused on US economic data with the core PCE deflator the dominating report as it is the Fed’s preferred measure of inflation. From a Japanese perspective, BoJ officials are scattered throughout alongside retail sales and unemployment data.
USD/JPY ECONOMIC CALENDAR (GMT +02:00)

Source: DailyFX economic calendar
Money market pricing (see table below) forecasts a rate hike towards the latter part of 2024 as but incoming data will remain highly influential and could drastically change expectations as we have seen with many central banks this year.
BANK OF JAPAN INTEREST RATE PROBABILITIES

Source: Refinitiv
Want to stay updated with the most relevant trading information? Sign up for our bi-weekly newsletter and keep abreast of the latest market moving events!
Trade Smarter – Sign up for the DailyFX Newsletter
Receive timely and compelling market commentary from the DailyFX team
Subscribe to Newsletter
USD/JPY TECHNICAL ANALYSIS
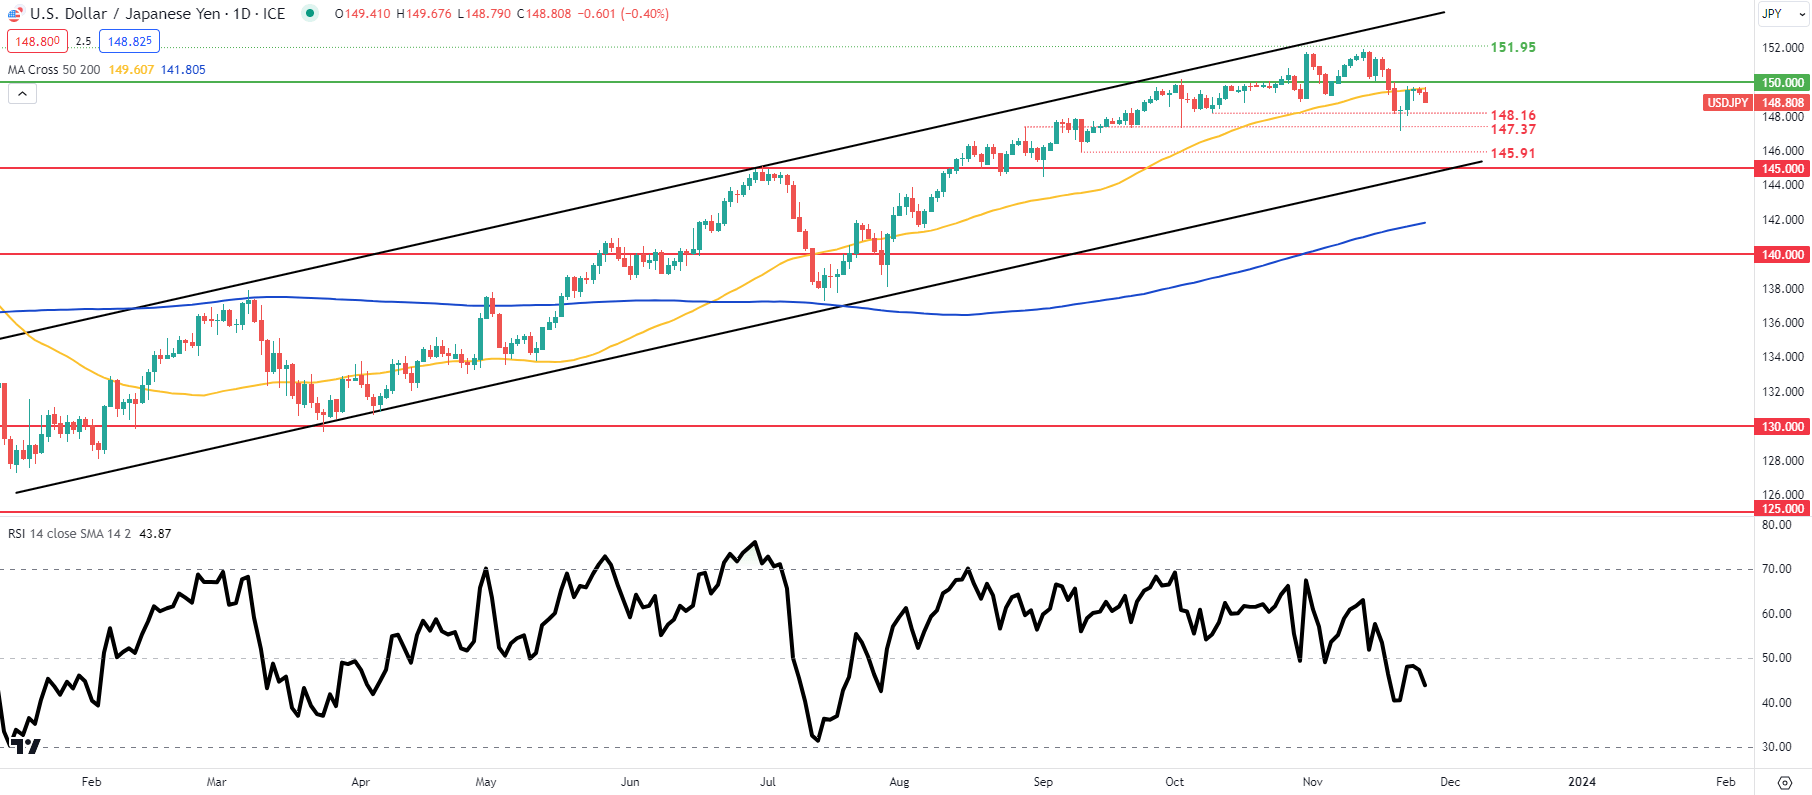
USD/JPY DAILY CHART

Chart prepared by Warren Venketas, IG
Daily USD/JPY price action has been respectful of the 50-day moving average (yellow) of recent with the Relative Strength Index (RSI) now favoring bearish momentum short-term. That being said, last week’s weekly candle close formed a hammer-like candlestick that could suggest a longer-term bullish preference. The last few daily candles now resemble an ascending triangle type pattern – another bullish advocate.
Key resistance levels:
Key support levels:
- 148.16
- 50-day moving average (yellow)
- 147.37
- 145.91
- 145.00
IG CLIENT SENTIMENT: MIXED
IGCS shows retail traders are currently net SHORT on USD/JPY, with 81% of traders currently holding short positions (as of this writing).
Curious to learn how market positioning can affect asset prices? Our sentiment guide holds the insights—download it now!
Introduction to Technical Analysis
Market Sentiment
Recommended by Warren Venketas
Contact and followWarrenon Twitter:@WVenketas


 آموزش مجازی مدیریت عالی و حرفه ای کسب و کار DBA


ارسال نظر شما
مجموع نظرات : 0 در انتظار بررسی : 0 انتشار یافته : 0