Bitcoin (BTC) and Ethereum (ETH) Prices, Charts, and Analysis:
- Bitcoin is rallying ahead of Wednesday’s FOMC meeting.
- Open interest is moving higher.
Learn How toTrade Cryptocurrencies
Recommended by Nick Cawley
Get Your Free Introduction To Cryptocurrency Trading
Bitcoin is back above $27k today as open interest in the largest cryptocurrency by market cap continues to build. Monday’s rally saw Bitcoin OI increase by over $1billion before falling back sharply later in the day. According to data from Coinalyze Bitcoin aggregate open interest is now close to $8.6bn, up $400 million today but off Monday’s multi-month high of just under $9bn. An increase in open interest leads to increased market liquidity and points towards a growing market consensus for BTC
Recommended by Nick Cawley
Building Confidence in Trading
With no obvious drivers for the move higher, the rumor mill centers around either ongoing buying by Michael Saylor/MicroStrategy – Saylor currently owns over 152k BTC – or asset managers buying Bitcoin ahead of any potential spot ETF announcement. The SEC deadline for the second round of spot Bitcoin ETF decisions is October 16th and 17th. On Wednesday the FOMC announces its latest policy decision with the market fully expecting interest rates to remain on hold. The post-decision press conference will be worth listening to, especially if chair Powell reiterates that rates can still go higher.
DailyFX Economic Calendar
Learn How to Use the Economic Calendar as Part of Your Trading Strategy
Recommended by Nick Cawley
Introduction to Forex News Trading
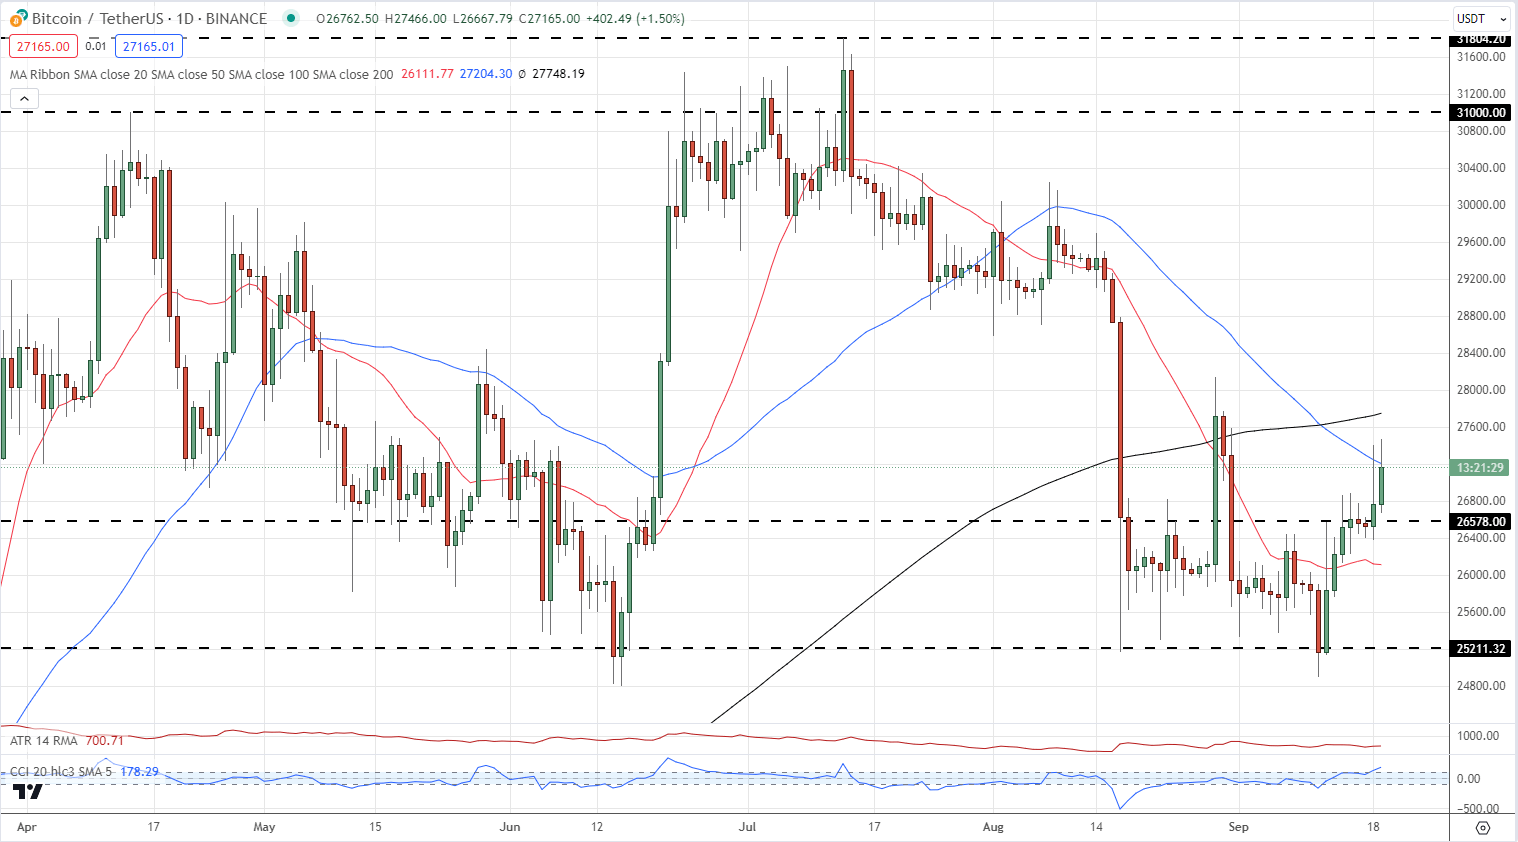
The daily Bitcoin chart is giving out mixed signals with a bearish 50-/200-day sma ‘death cross’ seemingly negated by an open above a prior level of resistance just under $26.6k. The 50-dsma is also acting as short-term resistance and a successful break of this medium-term indicator would allow BTC to test both the 200-sdma, currently at $27,748, and the August 29 high at $28,142.
Bitcoin (BTC/USD) Daily Price Chart – September 19, 2023

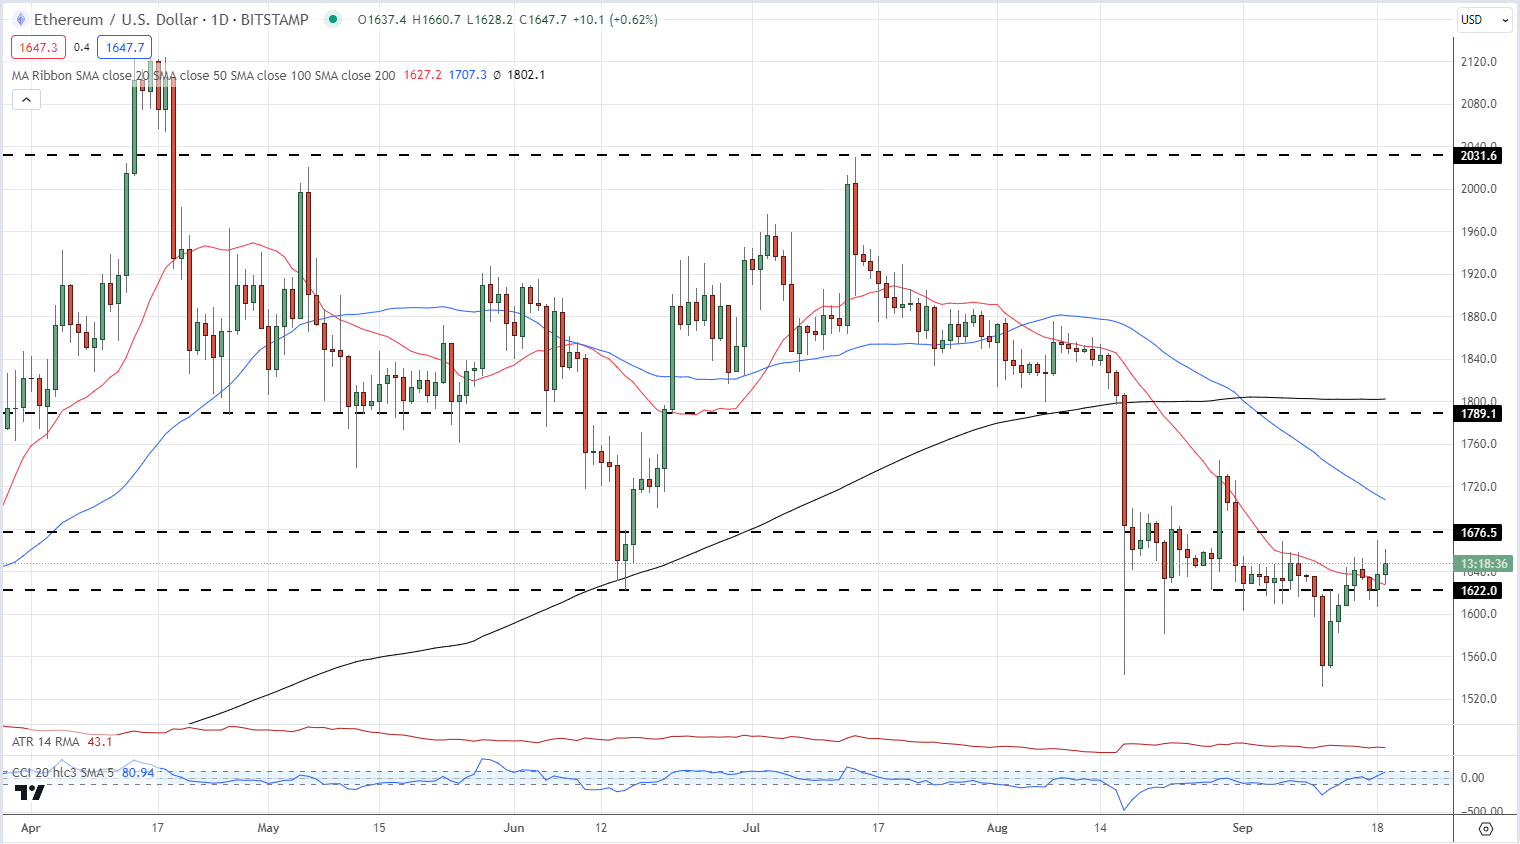
Ethereum is also pushing higher but is underperforming its peer Bitcoin. If support at $1,622 holds, then a re-test of $1,676 is on the cards before the 50-dsma, currently at $1,707 comes into focus.
Ethereum (ETH/USD) Daily Price Chart – September 19, 2023

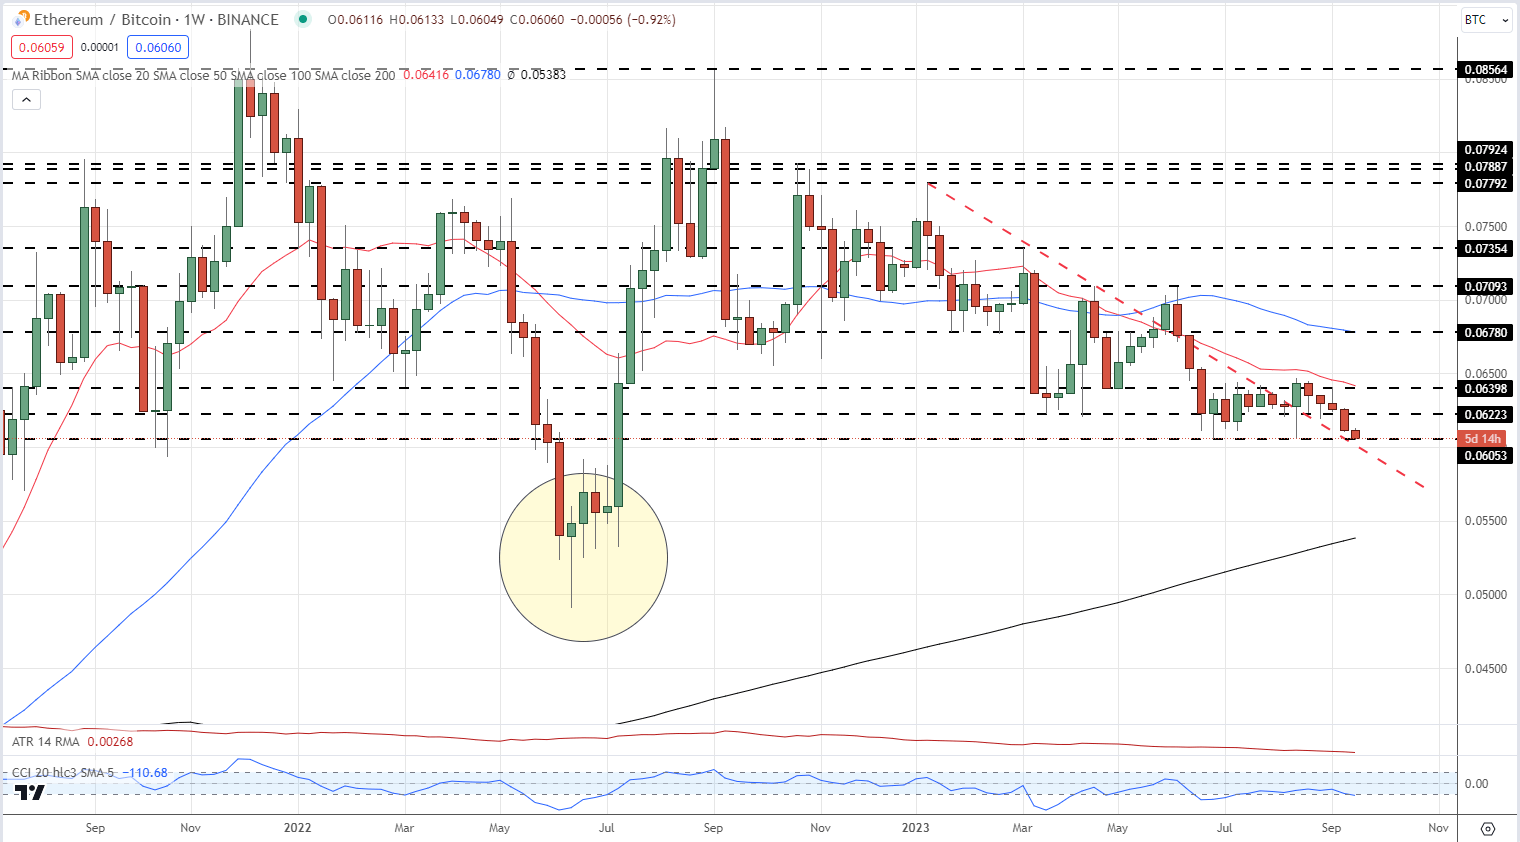
Ethereum continues to underperform Bitcoin, with the ETH/BTC now testing a multi-month low. The weekly chart looks ominous very little in the way of support until we get to the May/June/July lows seen in 2022.
ETH/BTC Weekly Chart

Charts by TradingView
What is your view on Bitcoin and Ethereum – bullish or bearish?? You can let us know via the form at the end of this piece or you can contact the author via Twitter @nickcawley1.


 آموزش مجازی مدیریت عالی و حرفه ای کسب و کار DBA


ارسال نظر شما
مجموع نظرات : 0 در انتظار بررسی : 0 انتشار یافته : ۰