Australian Dollar sinks after dismal Chinese trade data
[ad_1] Share: Australian Dollar returns to its bearish course after China releases below-expectations trade figures for July. The data suggests Chinese demand for Australian raw materials will lessen. The US Dollar rises on increased safe-haven buying following the poor data. The Australian Dollar (AUD) dives to new monthly lows against the US Dollar

[ad_1]
- Australian Dollar returns to its bearish course after China releases below-expectations trade figures for July.
- The data suggests Chinese demand for Australian raw materials will lessen.
- The US Dollar rises on increased safe-haven buying following the poor data.
The Australian Dollar (AUD) dives to new monthly lows against the US Dollar (USD) on Tuesday after the release of weak Chinese trade data indicates lower demand for Australian raw materials from the world’s second-largest economy and a general slowdown in the global economy.
Commentary from Federal Reserve Bank of Philadelphia President Patrick Harker’s on Tuesday, may have taken the edge off the Aussie’s collapse when he commented, “we may be at the point where we can be patient and hold rates steady,” suggesting peak interest rates might be in place. Federal Reserve Bank of Richmond President Thomas Barkin, however, talked up the economy saying GDP remained “solid”.
AUD/USD trades in the lower 0.65s during the US session.
Australian Dollar news and market movers
- The Australian Dollar reverses and dives to new lows for the summer after the release of China Trade Balance data shows a substantial decline in imports and exports.
- The data stokes fears China may be slowing down, that its property bubble could be on the brink of bursting, and that the global economy could start to decline.
- It indicates reduced demand for commodities, especially Australia’s main export Iron Ore, traditionally imported and used to make steel for China’s vast property and infrastructure projects.
- Measured in US Dollars, Chinese imports fell by 12.4% which was well below the 5.0% decline expected by economists and the 6.8% drop in the previous month of June.
- In Yuan, imports fell 6.9% vs. -2.5% expected, and -2.6% previous.
- Chinese exports in USD fell 14.5% against -12.5% expected and -12.4% recorded in June. In Yuan, exports declined 9.2% versus -8.9% forecast and -8.3% previously.
- The Chinese trade balance in USD showed an $80.6B surplus versus the 70.6B expected and 70.62B previous.
- In Yuan terms, the Trade Balance showed a surplus of 575.5B versus 625.25B forecast and 491.25B previous.
- Australian data showed a decline into negative territory for the Westpac Consumer Confidence for August, which fell to -0.4% from 2.7% in July.
- National Australia Bank’s (NAB) Business Conditions in July edged down to 10 from 11 in June but still beat estimates of 8. NAB’s Business Confidence gauge rose to 2 from -1 forecast and -1 previous.
- US 10-year Treasury Bond yields dived to below 4.000% again as demand for US T-bonds increased on the back of a flight to safety. This supported the Greenback, with the US Dollar Index (DXY) rising 0.5% on Tuesday.
- China’s policy of trying to diversify away from relying too heavily on Australian raw materials is a long-term negative for the Aussie, according to Clifford Bennet, Chief Economist at ACY Securities.
- The Aussie economy will not be ‘saved’ as it has done in the past by Chinese super-growth according to ACY’s Bennet.
- AUD/USD could fall to as low as 0.40, according to David Llewellyn-Smith, Chief Strategist at the MB Fund and MB Super.
- He likens the current market conditions to those in the 1990s, comparing China to Japan, which similarly underwent an economic boom before peaking in the 90s when the Japanese property bubble burst, bringing the good times to an end. Llewellyn-Smith foresees the same fate for China.
- He further expects the US Dollar to maintain its value as the AI revolution creates a tech boom in the US, just as the dot-com bubble did in the 90s.
- The Australian Dollar has been on a weak footing since the RBA left the policy rate unchanged at 4.1% last week, against the market expectation for a 25 basis point hike. In the policy statement, the RBA explained that the decision to hold rates unchanged would provide them more time to assess the impact of policy tightening to date and the economic outlook.
- That said, they did not completely rule out the possibility of more rate hikes in the future, “Some further tightening of monetary policy may be required to ensure that inflation returns to target in a reasonable timeframe, but that will depend upon the data and the evolving assessment of risks,” the RBA noted.
Australian Dollar technical analysis
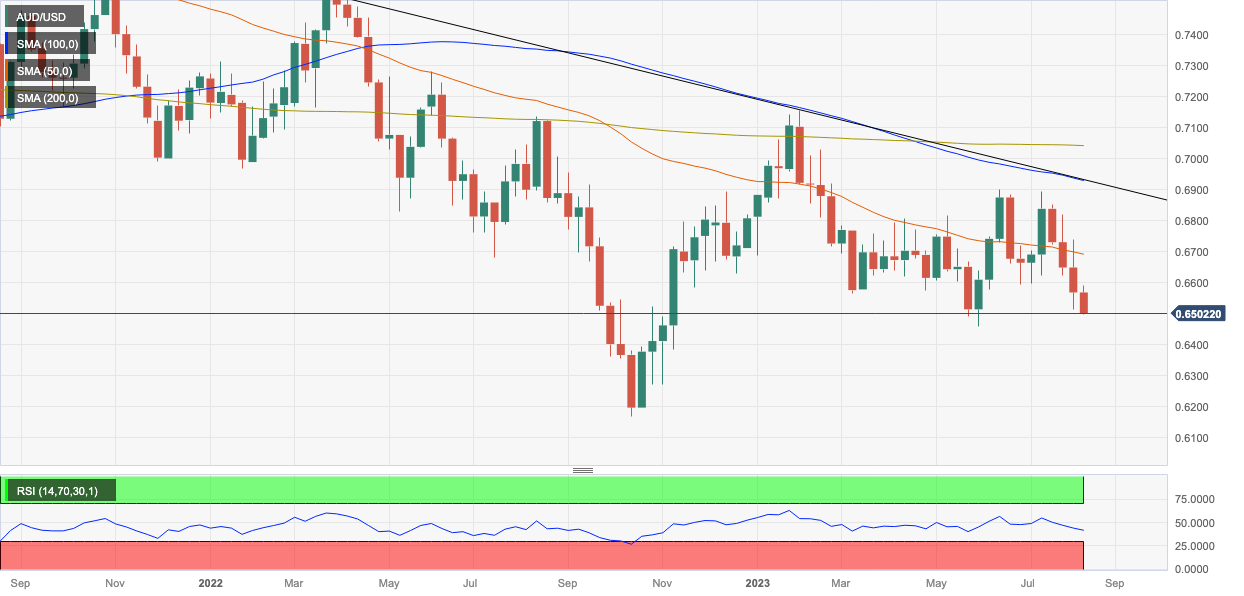
AUD/USD is in a sideways trend on both the long and medium-term charts. The February high at 0.7158 is a key hurdle, which if vaulted, will give the longer-term charts a more bullish tone.
The 0.6458 low established in June is a key level for bears. If this is breached decisively, it would color the charts more bearish. Price is currently closer to this key low.

Australian Dollar vs US Dollar: Weekly Chart
Price has now broken cleanly below the confluence of moving averages (MA) close to 0.6700, made up of most of the major SMAs – the 50-week, 50-day and 100-day. The breaching of this key support and resistance level is a bearish sign.

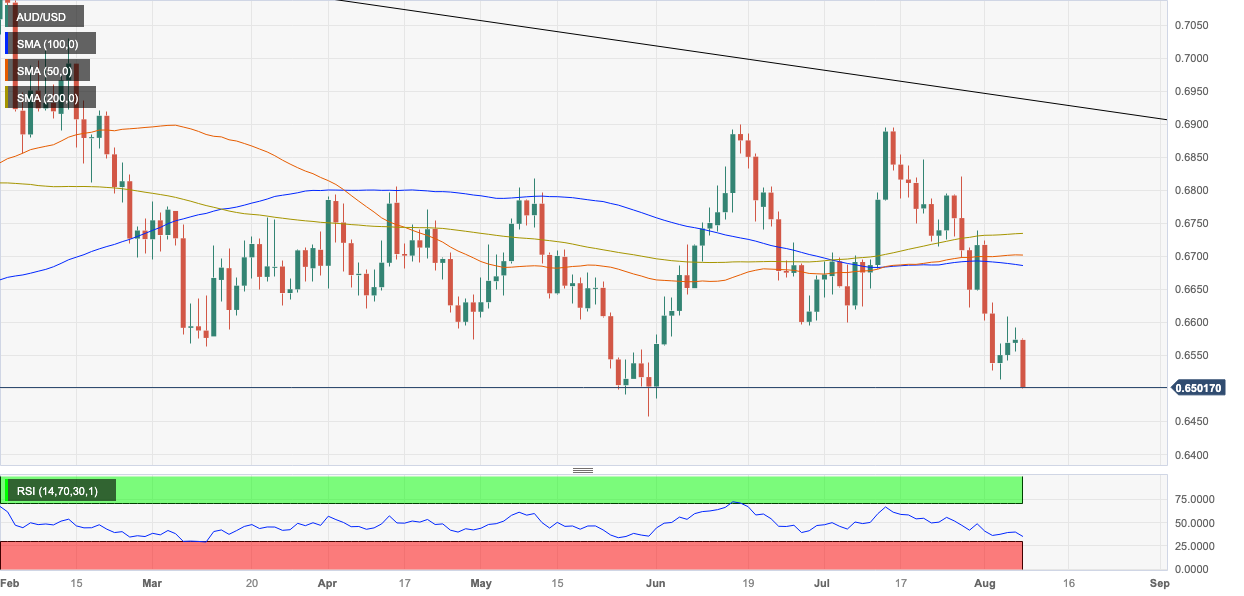
Australian Dollar vs US Dollar: Daily Chart
AUD/USD has also broken below the 0.6600 June lows, and a continuation down to the key May lows at 0.6460, is quite possible. A decisive break below them would open the way for a move down to 0.6170 and the 2022 lows.
Because the pair is in a sideways trend overall, it is unpredictable, and the probabilities do not favor either bears or bulls overall – nor is the Relative Strength Index (RSI) providing much insight on either timeframe.
In technical terms, a ‘decisive break’ consists of a long daily candlestick, which pierces cleanly above or below the critical level in question and then closes near to the high or low of the day. It can also mean three up or down days in a row that break cleanly above or below the level, with the final day closing near its high or low and a decent distance away from the level.
Fed FAQs
Monetary policy in the US is shaped by the Federal Reserve (Fed). The Fed has two mandates: to achieve price stability and foster full employment. Its primary tool to achieve these goals is by adjusting interest rates.
When prices are rising too quickly and inflation is above the Fed’s 2% target, it raises interest rates, increasing borrowing costs throughout the economy. This results in a stronger US Dollar (USD) as it makes the US a more attractive place for international investors to park their money.
When inflation falls below 2% or the Unemployment Rate is too high, the Fed may lower interest rates to encourage borrowing, which weighs on the Greenback.
The Federal Reserve (Fed) holds eight policy meetings a year, where the Federal Open Market Committee (FOMC) assesses economic conditions and makes monetary policy decisions.
The FOMC is attended by twelve Fed officials – the seven members of the Board of Governors, the president of the Federal Reserve Bank of New York, and four of the remaining eleven regional Reserve Bank presidents, who serve one-year terms on a rotating basis.
In extreme situations, the Federal Reserve may resort to a policy named Quantitative Easing (QE). QE is the process by which the Fed substantially increases the flow of credit in a stuck financial system.
It is a non-standard policy measure used during crises or when inflation is extremely low. It was the Fed’s weapon of choice during the Great Financial Crisis in 2008. It involves the Fed printing more Dollars and using them to buy high grade bonds from financial institutions. QE usually weakens the US Dollar.
Quantitative tightening (QT) is the reverse process of QE, whereby the Federal Reserve stops buying bonds from financial institutions and does not reinvest the principal from the bonds it holds maturing, to purchase new bonds. It is usually positive for the value of the US Dollar.
.
[ad_2]
لینک منبع : هوشمند نیوز
 آموزش مجازی مدیریت عالی حرفه ای کسب و کار Post DBA آموزش مجازی مدیریت عالی حرفه ای کسب و کار Post DBA+ مدرک معتبر قابل ترجمه رسمی با مهر دادگستری و وزارت امور خارجه |  آموزش مجازی مدیریت عالی و حرفه ای کسب و کار DBA آموزش مجازی مدیریت عالی و حرفه ای کسب و کار DBA+ مدرک معتبر قابل ترجمه رسمی با مهر دادگستری و وزارت امور خارجه |  آموزش مجازی مدیریت کسب و کار MBA آموزش مجازی مدیریت کسب و کار MBA+ مدرک معتبر قابل ترجمه رسمی با مهر دادگستری و وزارت امور خارجه |
 مدیریت حرفه ای کافی شاپ |  حقوقدان خبره |  سرآشپز حرفه ای |
 آموزش مجازی تعمیرات موبایل آموزش مجازی تعمیرات موبایل |  آموزش مجازی ICDL مهارت های رایانه کار درجه یک و دو |  آموزش مجازی کارشناس معاملات املاک_ مشاور املاک آموزش مجازی کارشناس معاملات املاک_ مشاور املاک |
برچسب ها :AUDUSD ، Australia ، Australian ، Chinese ، Data ، dismal ، Dollar ، Fundamental Analysis ، Sinks ، Technical analysis ، Trade
- نظرات ارسال شده توسط شما، پس از تایید توسط مدیران سایت منتشر خواهد شد.
- نظراتی که حاوی تهمت یا افترا باشد منتشر نخواهد شد.
- نظراتی که به غیر از زبان فارسی یا غیر مرتبط با خبر باشد منتشر نخواهد شد.


ارسال نظر شما
مجموع نظرات : 0 در انتظار بررسی : 0 انتشار یافته : 0