AUD/USD ANALYSIS & TALKING POINTS
- Weak Chinese factory activity figures limit AUD upside.
- US CB consumer confidence in focus later today.
- Bulls attempt upside breakout as descending triangle resistance comes under pressure.
Elevate your trading skills and gain a competitive edge. Get your hands on the Australian dollar Q4 outlook today for exclusive insights into key market catalysts that should be on every trader’s radar.
Recommended by Warren Venketas
Get Your Free AUD Forecast
AUSTRALIAN DOLLAR FUNDAMENTAL BACKDROP
The Australian dollar is trading lower against the US dollar this morning after Chinese PMI’s disappointed (see economic calendar below). This slowdown in activity led to most soft commodities, precious and base metals to fall thus weighing negatively on the AUD – a key commodity trading partner with China. After moving back into expansionary territory for the first time since April last month, the manufacturing print has now fallen back below the 50 mark. Despite missing forecasts, efforts by the Chinese government to stimulate the economy could still follow through and reinvigorate the economy moving forward.
AUD/USD ECONOMIC CALENDAR (GMT +02:00)
Source: DailyFX economic calendar
The Reserve Bank of Australia’s (RBA) Assistant Governor Brad Jones spoke earlier this morning but did not give much away in the form of monetary policy; however, the statement below highlighted the uncertainty around interest rates:
“War, global trade disruptions, cyberattacks and climate change could make interest rates more volatile”
One positive from an AUD perspective came via the housing credit MoM figure that reached fresh yearly highs at 0.4%. That being said, inflation has been relatively sticky and keeps the RBA rate decision on November 7th in favor of a 25bps rate hike (refer to table below). Later today, the US CB consumer confidence print will come into focus as well as labor cost data ahead of Friday’s Non-Farm Payroll (NFP) report. .
RBA INTEREST RATE PROBABILITIES

Source: Refinitiv
TECHNICAL ANALYSIS
AUD/USD DAILY CHART

Chart prepared by Warren Venketas, TradingView
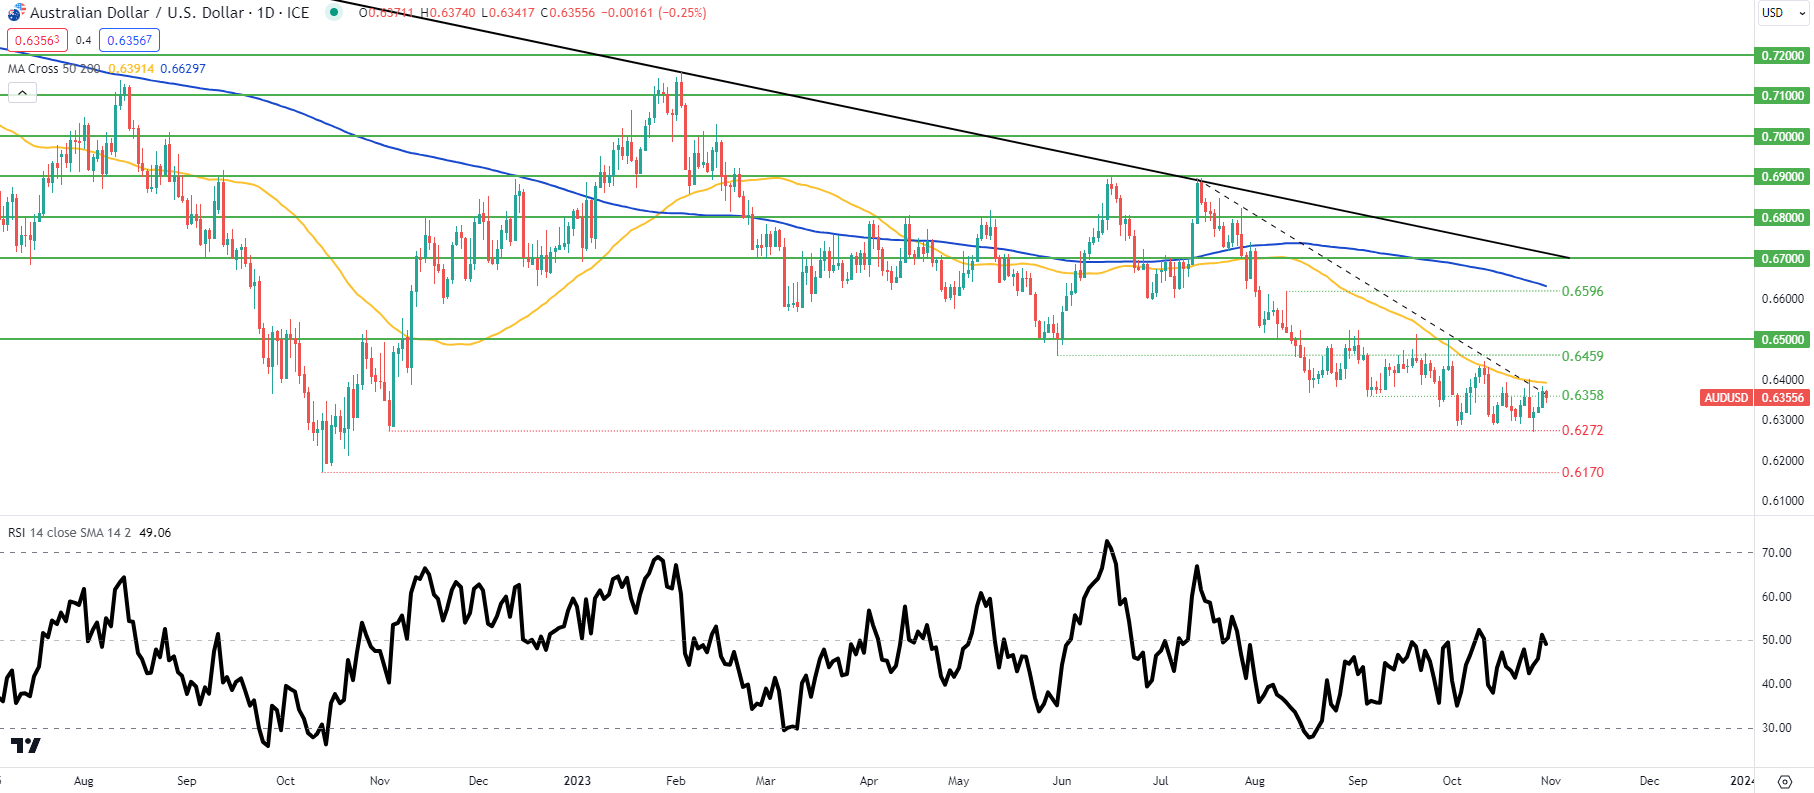
Daily AUD/USD price action above is finding defiance around the longer-term trendline resistance (dashed black line) zone. Bulls will be looking for a confirmation close above this zone as well as the 50-day moving average (yellow) before looking to capitalize on a potential reversal.
From a bearish standpoint, the descending triangle pattern with support around 0.6272 is still developing and could remain in consideration should prices slip.
Key resistance levels:
- 0.6500
- 0.6459
- 50-day moving average (yellow)
- Trendline resistance
- 0.6358
Key support levels:
IG CLIENT SENTIMENT DATA: BULLISH (AUD/USD)
IGCS shows retail traders are currently net LONG on AUD/USD, with 73% of traders currently holding long positions.
Download the latest sentiment guide (below) to see how daily and weekly positional changes affect AUD/USD sentiment and outlook.
Introduction to Technical Analysis
Market Sentiment
Recommended by Warren Venketas
Contact and followWarrenon Twitter:@WVenketas


 آموزش مجازی مدیریت عالی و حرفه ای کسب و کار DBA


ارسال نظر شما
مجموع نظرات : 0 در انتظار بررسی : 0 انتشار یافته : ۰