
AUD/USD declines to 0.6450 as the USD recovers
[ad_1] Share: AUD/USD retreated below the 20-day SMA towards 0.6450. The August NFP report from the US sent mixed signals from the US labour market. The Greenback benefited from higher-than-expected ISM PMIs. In Friday’s session, the USD initially dropped and found support at the 20-day Simple Moving Average (SMA) of 103.30 but then

[ad_1]
- AUD/USD retreated below the 20-day SMA towards 0.6450.
- The August NFP report from the US sent mixed signals from the US labour market.
- The Greenback benefited from higher-than-expected ISM PMIs.
In Friday’s session, the USD initially dropped and found support at the 20-day Simple Moving Average (SMA) of 103.30 but then managed to recover towards 104.20. The US reported mixed Nonfarm Payrolls figures and strong PMI figures, while the Australian calendar had nothing relevant to offer, so the USD’s movements primarily directed the pair’s movements.
The Nonfarm Payrolls report, which measures the employment change in non-agricultural business, showed that the US added 187,000 jobs in August, a tick higher than the 170,000 expected and from the previous downwardly revised 157,000. On the negative side, Average Hourly Earnings increased, but slower than expected, while the Unemployment rate rose to 3.8% in the same month.
What drove the USD upwards was the data from the Institute for Supply Management (ISM), which reported higher than expected PMIs from August, with the manufacturing index at 47.6, higher than the 47 expected. The Employment Index also came strong at 48.5 but remains in contraction territory.
As a reaction, the 2,5 and 10-year US Treasury yields fell to their lowest levels in three weeks but then managed to clear their declines after the release of the ISM PMIs. In line with that, the CME FedWatch tool shows that the odds of a hike in the November meeting of the Fed declined to 33% after being around 40% in the last few days. It’s worth highlighting that the market’s volatility on Friday was driven by investors digesting key economic data. Chair Powell from the Federal Reserve (Fed) stated that the ongoing decisions will be decided “carefully” depending on the incoming data.
AUD/USD Levels to watch
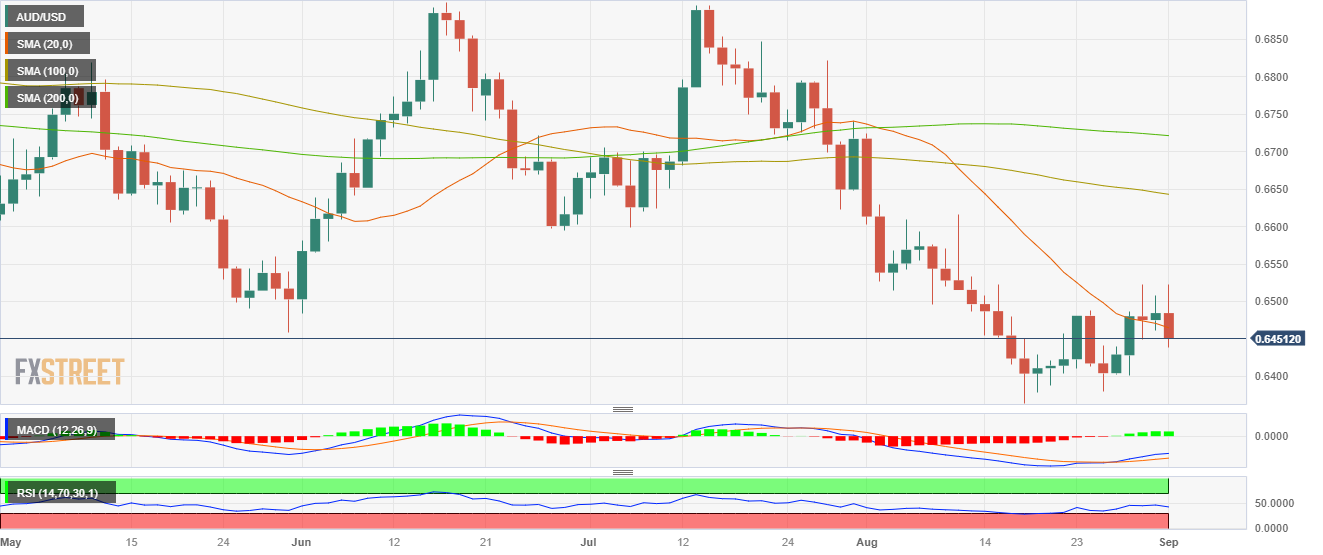
The AUD/USD daily chart analysis points to a bearish sentiment for the short term. The Relative Strength Index (RSI) is situated below its midline in negative territory, displaying a southward trajectory. Likewise, the Moving Average Convergence Divergence (MACD) reveals red bars, signifying a growing bearish momentum for AUD/USD. Additionally, the pair is below the 20,100 and 200-day Simple Moving Averages (SMAs), indicating that on the broader picture, the bears are still in command, and the buyers have work to do.
Support levels: 0.6430, 0.6400, 0.6390.
Resistance levels: 0.6460 (20-day SMA), 0.6480, 0.6500.
AUD/USD Daily Chart
[ad_2]
لینک منبع : هوشمند نیوز
 آموزش مجازی مدیریت عالی حرفه ای کسب و کار Post DBA آموزش مجازی مدیریت عالی حرفه ای کسب و کار Post DBA+ مدرک معتبر قابل ترجمه رسمی با مهر دادگستری و وزارت امور خارجه |  آموزش مجازی مدیریت عالی و حرفه ای کسب و کار DBA آموزش مجازی مدیریت عالی و حرفه ای کسب و کار DBA+ مدرک معتبر قابل ترجمه رسمی با مهر دادگستری و وزارت امور خارجه |  آموزش مجازی مدیریت کسب و کار MBA آموزش مجازی مدیریت کسب و کار MBA+ مدرک معتبر قابل ترجمه رسمی با مهر دادگستری و وزارت امور خارجه |
 مدیریت حرفه ای کافی شاپ |  حقوقدان خبره |  سرآشپز حرفه ای |
 آموزش مجازی تعمیرات موبایل آموزش مجازی تعمیرات موبایل |  آموزش مجازی ICDL مهارت های رایانه کار درجه یک و دو |  آموزش مجازی کارشناس معاملات املاک_ مشاور املاک آموزش مجازی کارشناس معاملات املاک_ مشاور املاک |
- نظرات ارسال شده توسط شما، پس از تایید توسط مدیران سایت منتشر خواهد شد.
- نظراتی که حاوی تهمت یا افترا باشد منتشر نخواهد شد.
- نظراتی که به غیر از زبان فارسی یا غیر مرتبط با خبر باشد منتشر نخواهد شد.


ارسال نظر شما
مجموع نظرات : 0 در انتظار بررسی : 0 انتشار یافته : 0