Australian Dollar, AUD/USD, AUD/JPY – Near-Term Technical Update:
Recommended by Daniel Dubrovsky
How to Trade AUD/USD
AUD/USD – Daily Chart
Recent performance in the Australian Dollar against the US Dollar and Japanese Yen is setting up an interesting technical landscape. On the daily chart below, AUD/USD surged on Thursday, leaving behind a Bullish Engulfing candlestick pattern. This can at times function as a reversal signal, but further confirmation from here is likely needed.
The pattern emerged as prices were unable to confirm a breakout under the 78.6% Fibonacci retracement level of 0.6382. On top of this, positive RSI divergence had been persisting, showing that downside momentum has been fading. As such, while early, there seems to be early indications of a reversal. But, confirmation is needed.
Keep a close eye on the 50-day Moving Average. The latter may hold as resistance, pivoting prices lower. Otherwise, breaking lower opens the door to facing the November low of 0.6272.
| Change in | Longs | Shorts | OI |
| Daily | -18% | 29% | -8% |
| Weekly | -18% | 32% | -8% |
Chart Created in TradingView
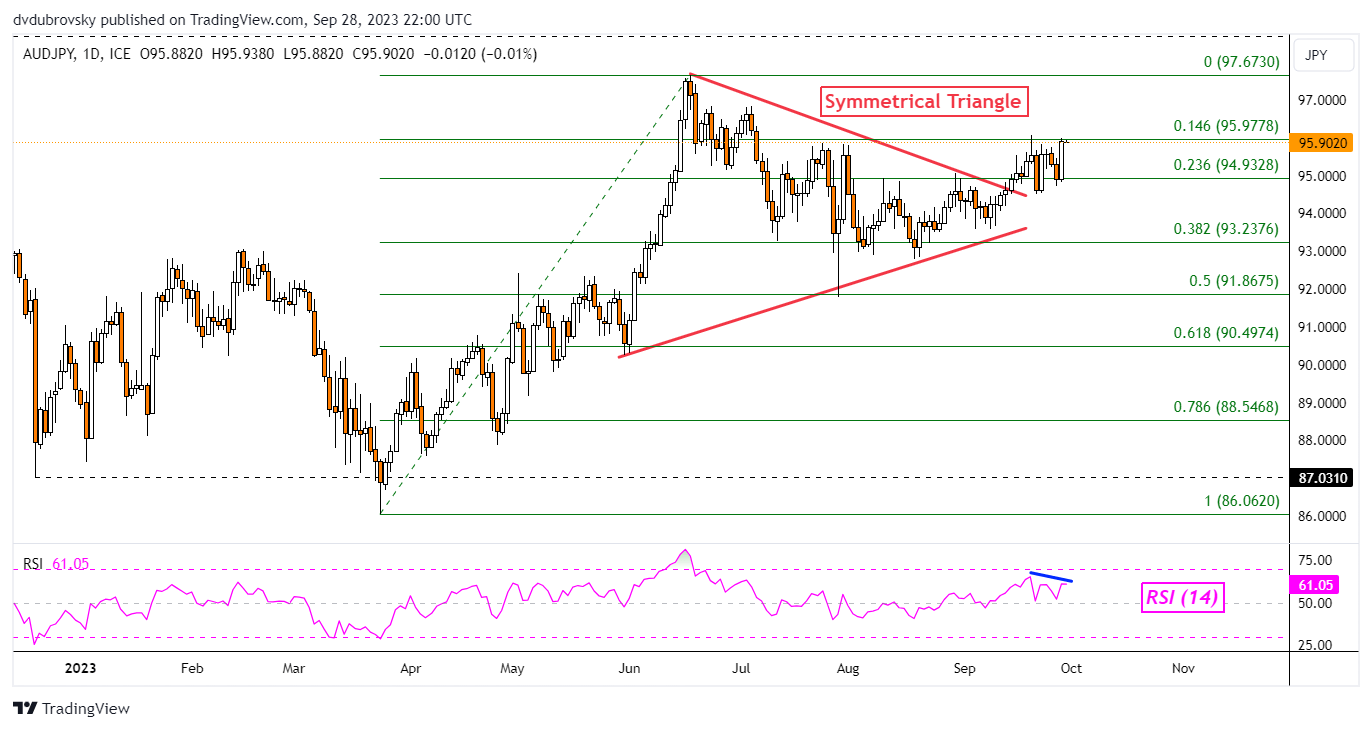
AUD/JPY – Daily Chart
Meanwhile, the Australian Dollar is also pushing higher against the Japanese Yen. Not long ago, AUD/JPY confirmed a breakout above a Symmetrical Triangle chart formation. That opened the door to extending the dominant uptrend since earlier this year.
Now, prices are facing the 14.6% Fibonacci retracement level at 95.97 as immediate resistance. Negative RSI divergence is present though, showing that upside momentum is fading. That can precede a turn lower.
Such an outcome would place the focus on immediate support, which seems to be the 23.6% level at 94.93. Otherwise, continuing higher places the focus on revisiting the current 2023 peak of 97.67.
| Change in | Longs | Shorts | OI |
| Daily | -14% | 5% | -1% |
| Weekly | -26% | 8% | -5% |

Chart Created in TradingView
— Written by Daniel Dubrovsky, Senior Strategist for DailyFX.com


 آموزش مجازی مدیریت عالی و حرفه ای کسب و کار DBA


ارسال نظر شما
مجموع نظرات : 0 در انتظار بررسی : 0 انتشار یافته : ۰