British Pound, GBP/USD, GBP/JPY – Technical Update:
Recommended by Daniel Dubrovsky
Get Your Free GBP Forecast
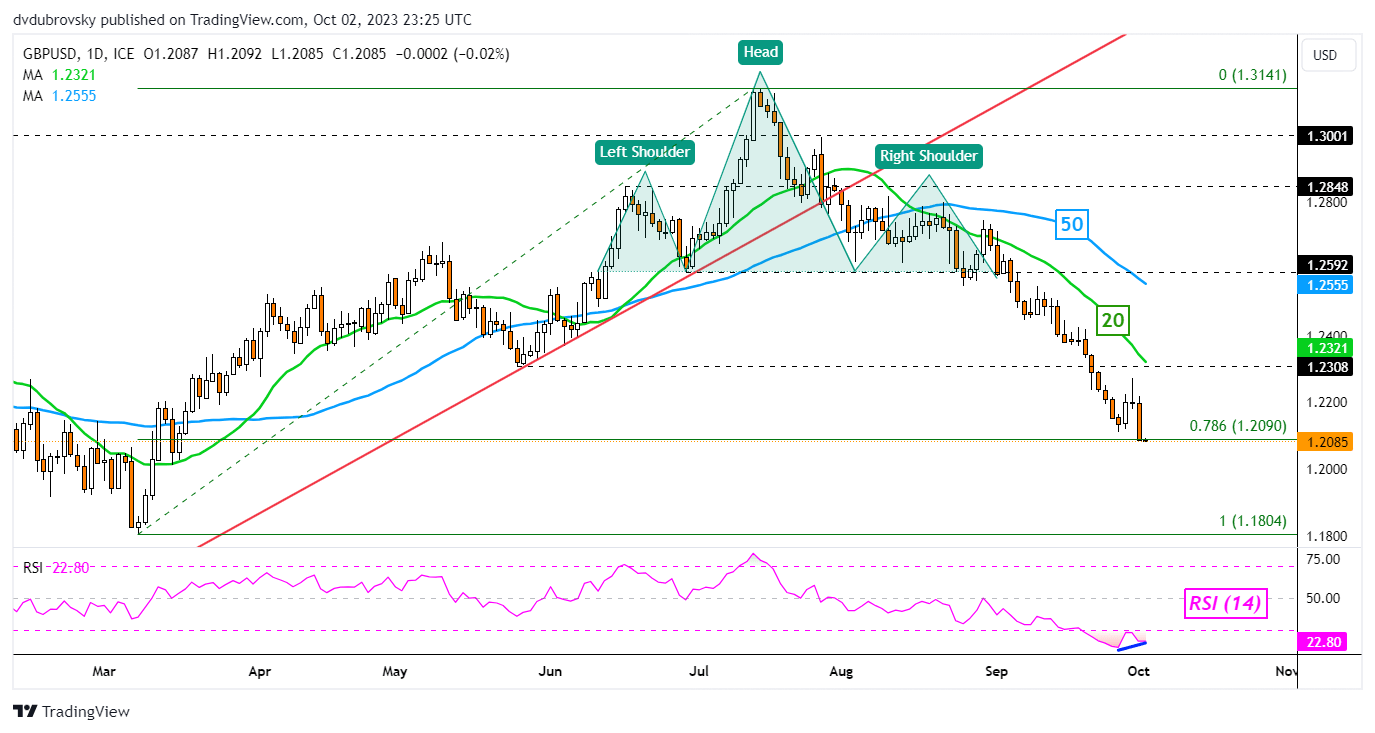
The British Pound appears to be increasingly vulnerable against the US Dollar and Japanese Yen from a technical perspective. On the daily chart below, GBP/USD has continued making downside progress in the aftermath of a bearish Head & Shoulders chart formation. Now, recent losses have brought the exchange rate to the 78.6% Fibonacci retracement level of 1.209.
There is a positive RSI divergence, which shows that downside momentum is fading. That can at times precede a turn lower. But, the 20- and 50-day moving averages remain sloping lower. These may hold as resistance, maintaining the broader downside focus. Further losses place the focus on the March low of 1.1804.
Recommended by Daniel Dubrovsky
How to Trade GBP/USD
GBP/USD – Daily Chart

Chart Created in TradingView
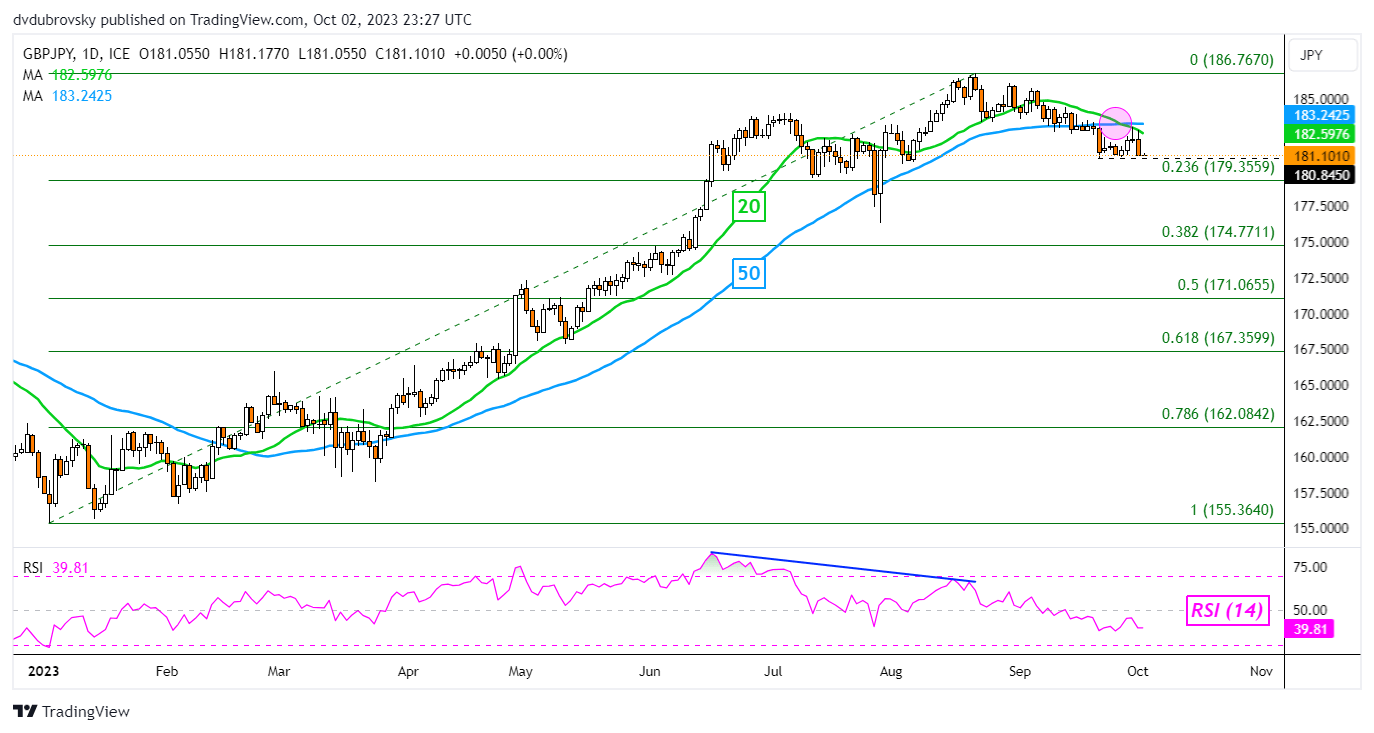
The Japanese Yen has been slightly more resilient to the British Pound compared to the US Dollar. GBP/JPY remains idling above the 180.84 support point that has been holding up since September. But, a Bearish Death Cross recently formed between the 20- and 50-day moving averages. This could spell further trouble for the exchange rate.
A breakout lower offers a stronger bearish technical bias, exposing the 23.6% Fibonacci retracement level at 179.35. Below that is the 38.2% point of 174.77. Meanwhile, immediate resistance are the near-term moving averages. Breaking above would offer a neutral bias, placing the focus on the August peak of 186.76.
| Change in | Longs | Shorts | OI |
| Daily | 16% | 8% | 10% |
| Weekly | -11% | -7% | -8% |
GBP/JPY – Daily Chart

Chart Created in TradingView
— Written by Daniel Dubrovsky, Senior Strategist for DailyFX.com


 آموزش مجازی مدیریت عالی و حرفه ای کسب و کار DBA


ارسال نظر شما
مجموع نظرات : 0 در انتظار بررسی : 0 انتشار یافته : 0