Japanese Yen, USD/JPY, NZD/JPY – Technical Update:
Recommended by Daniel Dubrovsky
Get Your Free JPY Forecast
The US Dollar has slowed its upside progress against the Japanese Yen of late. On the daily chart below, USD/JPY can be seen leveling off just under the 61.8% Fibonacci extension at 148.27, which is immediate resistance. Meanwhile, key support is the 146.56 inflection point from early August. In recent days, negative RSI divergence has emerged.
This is a sign of fading upside momentum, which can at times precede a turn lower. That would place the focus on the 20-day Moving Average, which may reinstate the upside focus. Still, even an extended move lower wouldn’t necessarily overturn the broader bullish bias. That is being maintained by rising support from March. Pushing higher places the focus on Last year’s high of 151.94.
| Change in | Longs | Shorts | OI |
| Daily | -5% | 2% | 0% |
| Weekly | 11% | -4% | -1% |
Chart Created in TradingView
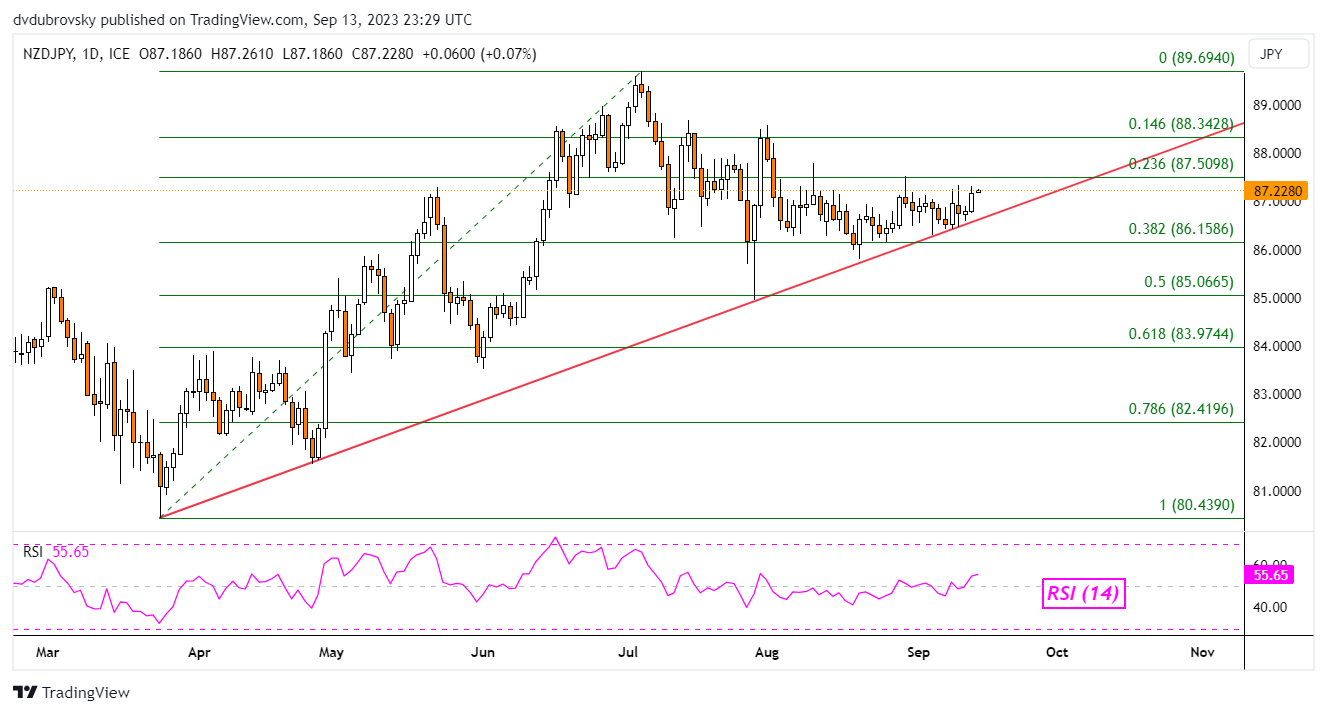
Meanwhile, the New Zealand Dollar may be readying to turn higher against the Japanese Yen. This has been following cautious downside pressure since June. Now, rising support from March is helping maintain the broader upside focus. Immediate resistance is the 23.6% Fibonacci retracement level of 87.50. Just above that is the minor 14.6% level at 88.34.
Extending beyond the latter would subsequently place the focus on the June peak of 89.69. In the event of a breakout under rising support, that would open the door to an increasingly bearish technical outlook. This exposes the 38.2% level at 86.15 as immediate support. Below that is the midpoint of the Fibonacci retracement at 85.06.
Recommended by Daniel Dubrovsky
The Fundamentals of Breakout Trading

Chart Created in TradingView
— Written by Daniel Dubrovsky, Senior Strategist for DailyFX.com


 آموزش مجازی مدیریت عالی و حرفه ای کسب و کار DBA


ارسال نظر شما
مجموع نظرات : 0 در انتظار بررسی : 0 انتشار یافته : ۰