British Pound, GBP/USD, Technical Analysis, Retail Trader Positioning – IGCS Update
- British Pound has been stabilizing against US Dollar
- Retail traders have been slowing becoming bearish
- Will GBP/USD reverse higher on the 200-day MA?
Recommended by Daniel Dubrovsky
Get Your Free GBP Forecast
The British Pound has been marking time in recent weeks, pausing a slow and steady decline against the US Dollar since July. That said, retail traders are reducing downside exposure of late. This can be seen by looking at IG Client Sentiment (IGCS), which often functions as a contrarian indicator. With that in mind, will Sterling reverse higher?
GBP/USD Sentiment Outlook – Bullish
The IGCS gauge shows that about 62% of retail traders are net-long GBP/USD. Since most of them are biased to the upside, this still hints that prices may continue falling down the road. But, downside exposure has increased by 5.22% and 9.71% compared to yesterday and last week, respectively. With that in mind, recent changes in exposure are hinting that prices may soon reverse higher.
| Change in | Longs | Shorts | OI |
| Daily | -11% | 5% | -5% |
| Weekly | 0% | 10% | 3% |
British Pound Daily Chart
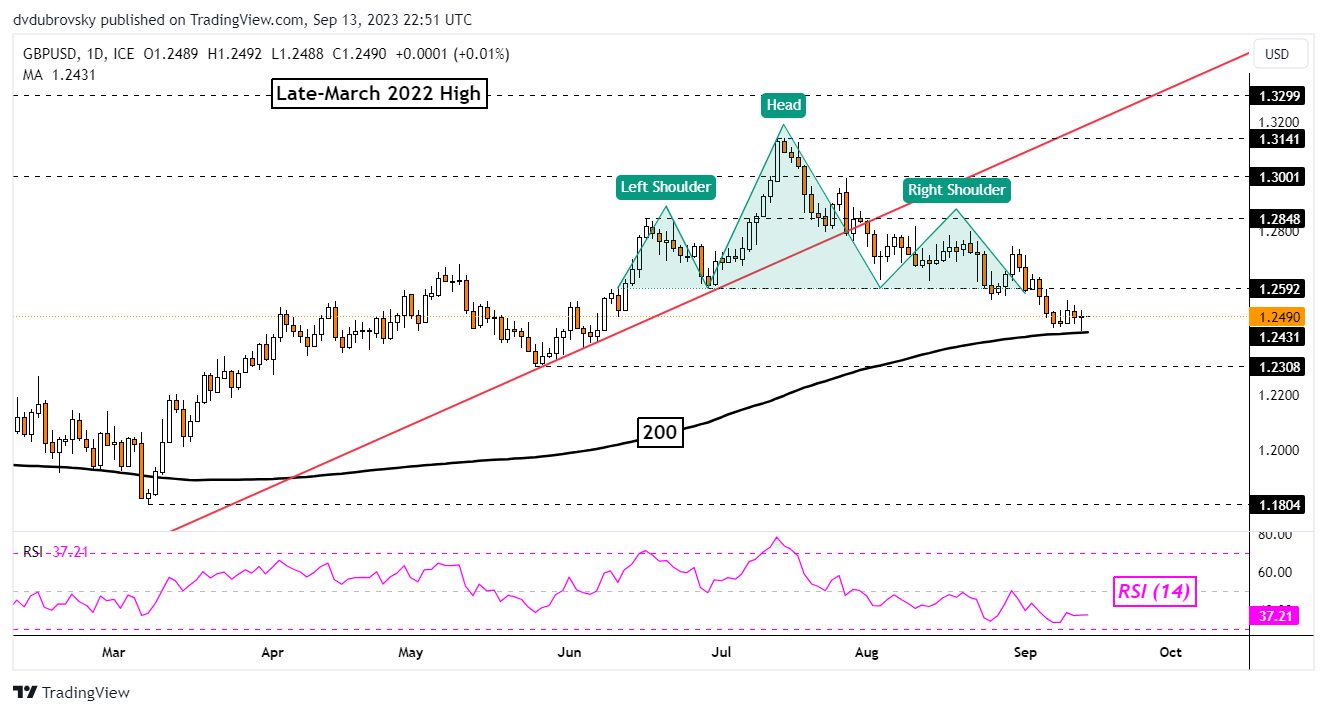
On the daily chart, GBP/USD remains technically biased lower in the aftermath of confirming a breakout under a bearish Head & Shoulders chart formation. But, since then, prices have been stabilizing around the 200-day Moving Average. The latter is thus maintaining the dominant upside focus.
A turn higher from here would place the focus on the neckline of the chart formation around 1.2592. Confirming a breakout above this point would undermine the Head & Shoulders, exposing the left shoulder around 1.2848.
Otherwise, breaking under the 200-day MA exposes the May low of 1.2308 as subsequent support.
Recommended by Daniel Dubrovsky
How to Trade GBP/USD

Chart Created in Trading View
— Written by Daniel Dubrovsky, Senior Strategist for DailyFX.com


 آموزش مجازی مدیریت عالی و حرفه ای کسب و کار DBA


ارسال نظر شما
مجموع نظرات : 0 در انتظار بررسی : 0 انتشار یافته : ۰