FTSE 100, DAX 40 and S&P 500 Drop Ahead of US CPI
Article by IG Senior Market Analyst Axel Rudolph FTSE 100, DAX 40, S&P 500 Analysis and Charts FTSE 100 drops on disappointing UK growth The FTSE 100 is about to end its four straight day winning streak as much weaker-than-expected UK GDP pushes the index lower. UK GDP dropped by 0.5% month-on-month in July, the

Article by IG Senior Market Analyst Axel Rudolph
FTSE 100, DAX 40, S&P 500 Analysis and Charts
FTSE 100 drops on disappointing UK growth
The FTSE 100 is about to end its four straight day winning streak as much weaker-than-expected UK GDP pushes the index lower. UK GDP dropped by 0.5% month-on-month in July, the quickest pace in seven months, versus an expected 0.2% decline. Year-on-year GDP dropped to 0% versus a forecast 0.4%.
The UK blue chip index is seen slipping back towards the 55-day simple moving average (SMA) at 7,476. Below it, the breached July-to-September downtrend line at 7,468, because of inverse polarity, might also act as support. While this and last week’s highs at 7,524 to 7,551 cap, the index is expected to range trade with a slight downward bias.
Only a rise and daily chart close above Tuesday’s high at 7,551 could open the way for the 200-day simple moving average (SMA) at 7,638.
FTSE 100 Daily Chart
Download the Free FTSE 100 Sentiment Report
| Change in | Longs | Shorts | OI |
| Daily | -9% | 6% | -2% |
| Weekly | -28% | 49% | -5% |
DAX 40 on track for second day of losses
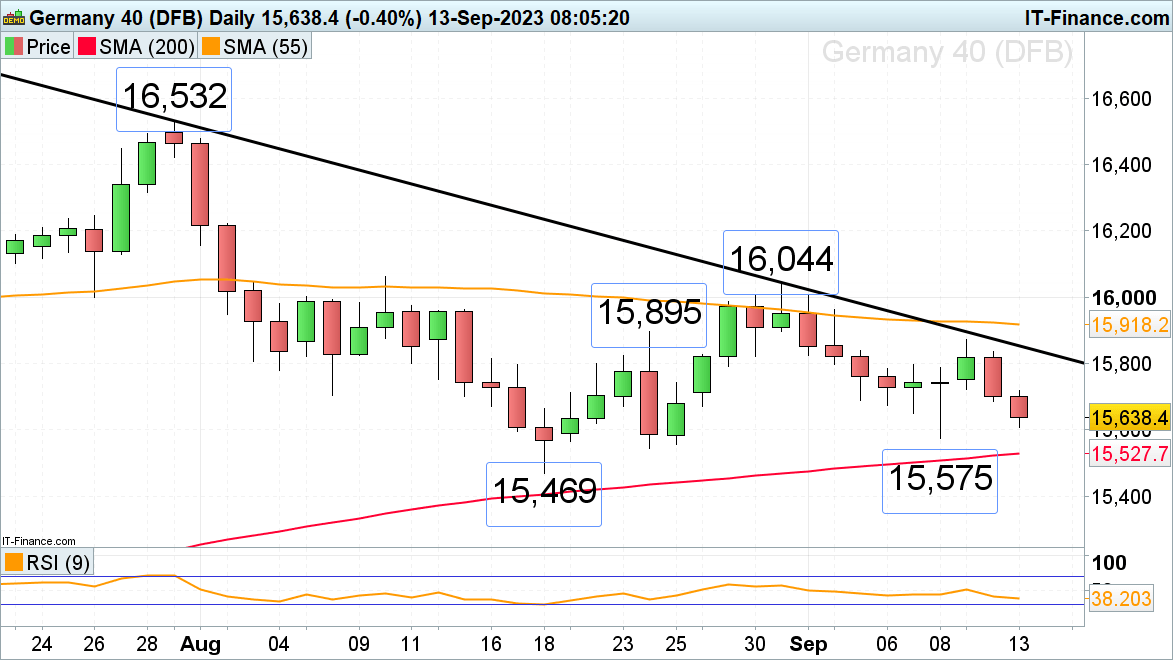
The DAX 40 is heading back down again as European Central Bank (ECB) sources suggested last night that inflation forecasts would remain above 3% in 2024, strengthening the view that an interest rate hike will follow at the meeting on Thursday. Last week’s low at 15,575 is thus back in focus. As long as it holds on a daily chart closing basis, Monday’s low at 15,723 may be revisited. The next higher July-to-September downtrend line at 15,850 and the 24 August high at 15,895 are unlikely to be revisited on Wednesday, though.
Were last week’s low at 15,575 to be slid through on a daily chart closing basis, the 200-day simple moving average (SMA) and August low at 15,528 to 15,469 would be in focus.
DAX 40 Daily Chart

Recommended by IG
Traits of Successful Traders
S&P 500under pressure
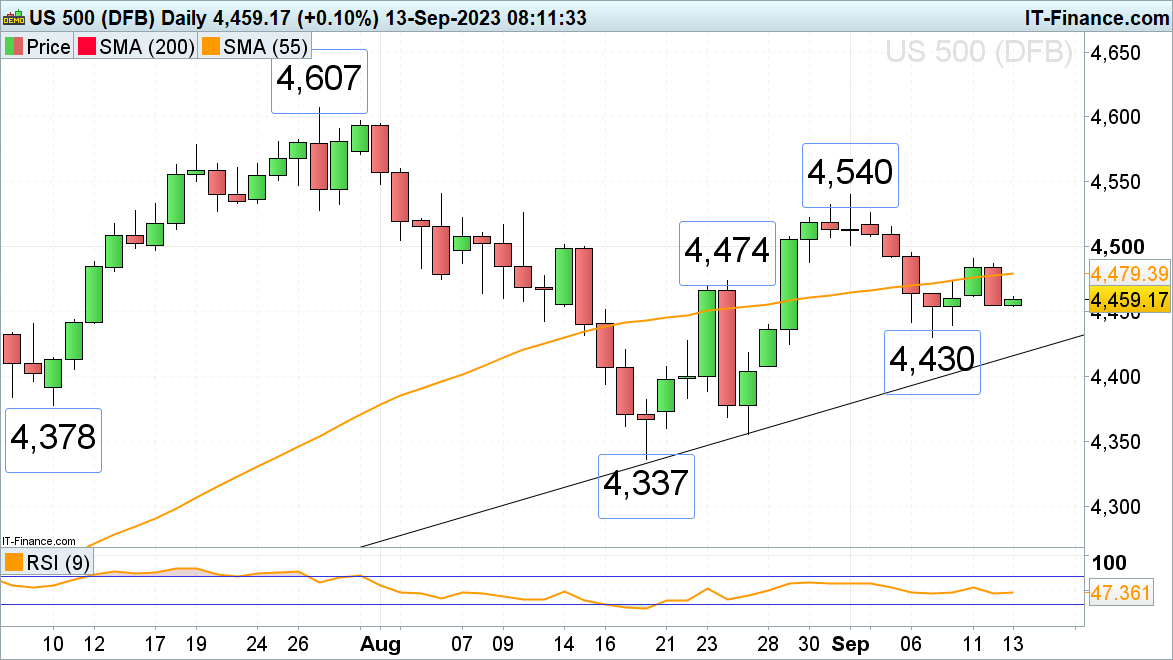
Following a weaker finish on Wall Street, where tech stocks fell after disappointment around the Apple product event and pre-CPI nervousness, the index remains under pressure. A tumble back toward last Thursday’s low at 4,430 low may be underway.
Provided that last week’s low at 4,430 holds, a bounce back towards the 24 August high and the 55-day simple moving average (SMA) at 4,474 to 4,479 may once more be seen, though. Above these sits this week’s high at 4,491 which needs to be overcome for the bulls to be back in control.A drop through 4,430 would put the March-to-September uptrend line at 4,416 on the map.
S&P 500 Daily Chart

Trade Smarter – Sign up for the DailyFX Newsletter
Receive timely and compelling market commentary from the DailyFX team
Subscribe to Newsletter
 آموزش مجازی مدیریت عالی حرفه ای کسب و کار Post DBA آموزش مجازی مدیریت عالی حرفه ای کسب و کار Post DBA+ مدرک معتبر قابل ترجمه رسمی با مهر دادگستری و وزارت امور خارجه |  آموزش مجازی مدیریت عالی و حرفه ای کسب و کار DBA آموزش مجازی مدیریت عالی و حرفه ای کسب و کار DBA+ مدرک معتبر قابل ترجمه رسمی با مهر دادگستری و وزارت امور خارجه |  آموزش مجازی مدیریت کسب و کار MBA آموزش مجازی مدیریت کسب و کار MBA+ مدرک معتبر قابل ترجمه رسمی با مهر دادگستری و وزارت امور خارجه |
 مدیریت حرفه ای کافی شاپ |  حقوقدان خبره |  سرآشپز حرفه ای |
 آموزش مجازی تعمیرات موبایل آموزش مجازی تعمیرات موبایل |  آموزش مجازی ICDL مهارت های رایانه کار درجه یک و دو |  آموزش مجازی کارشناس معاملات املاک_ مشاور املاک آموزش مجازی کارشناس معاملات املاک_ مشاور املاک |
- نظرات ارسال شده توسط شما، پس از تایید توسط مدیران سایت منتشر خواهد شد.
- نظراتی که حاوی تهمت یا افترا باشد منتشر نخواهد شد.
- نظراتی که به غیر از زبان فارسی یا غیر مرتبط با خبر باشد منتشر نخواهد شد.


ارسال نظر شما
مجموع نظرات : 0 در انتظار بررسی : 0 انتشار یافته : ۰