

Canadian Dollar, USD/CAD, Technical Analysis, Retail Trader Positioning – IGCS Update
- Canadian Dollar depreciated to its weakest level since late May
- Retail traders have been increasing USD/CAD downside bets
- Alongside technical cues, positioning supports a bullish bias
Recommended by Daniel Dubrovsky
What is the outlook for the US Dollar?
The Canadian Dollar continued its losing streak against the US Dollar over the past 24 hours as financial markets priced in a higher terminal Federal Funds Rate. With recent gains in USD/CAD, retail traders have responded by increasing downside exposure. This can be seen by taking a look at IG Client Sentiment (IGCS), which often functions as a contrarian indicator. With that in mind, will USD/CAD extend its winning streak ahead?
USD/CAD Sentiment Outlook – Bullish
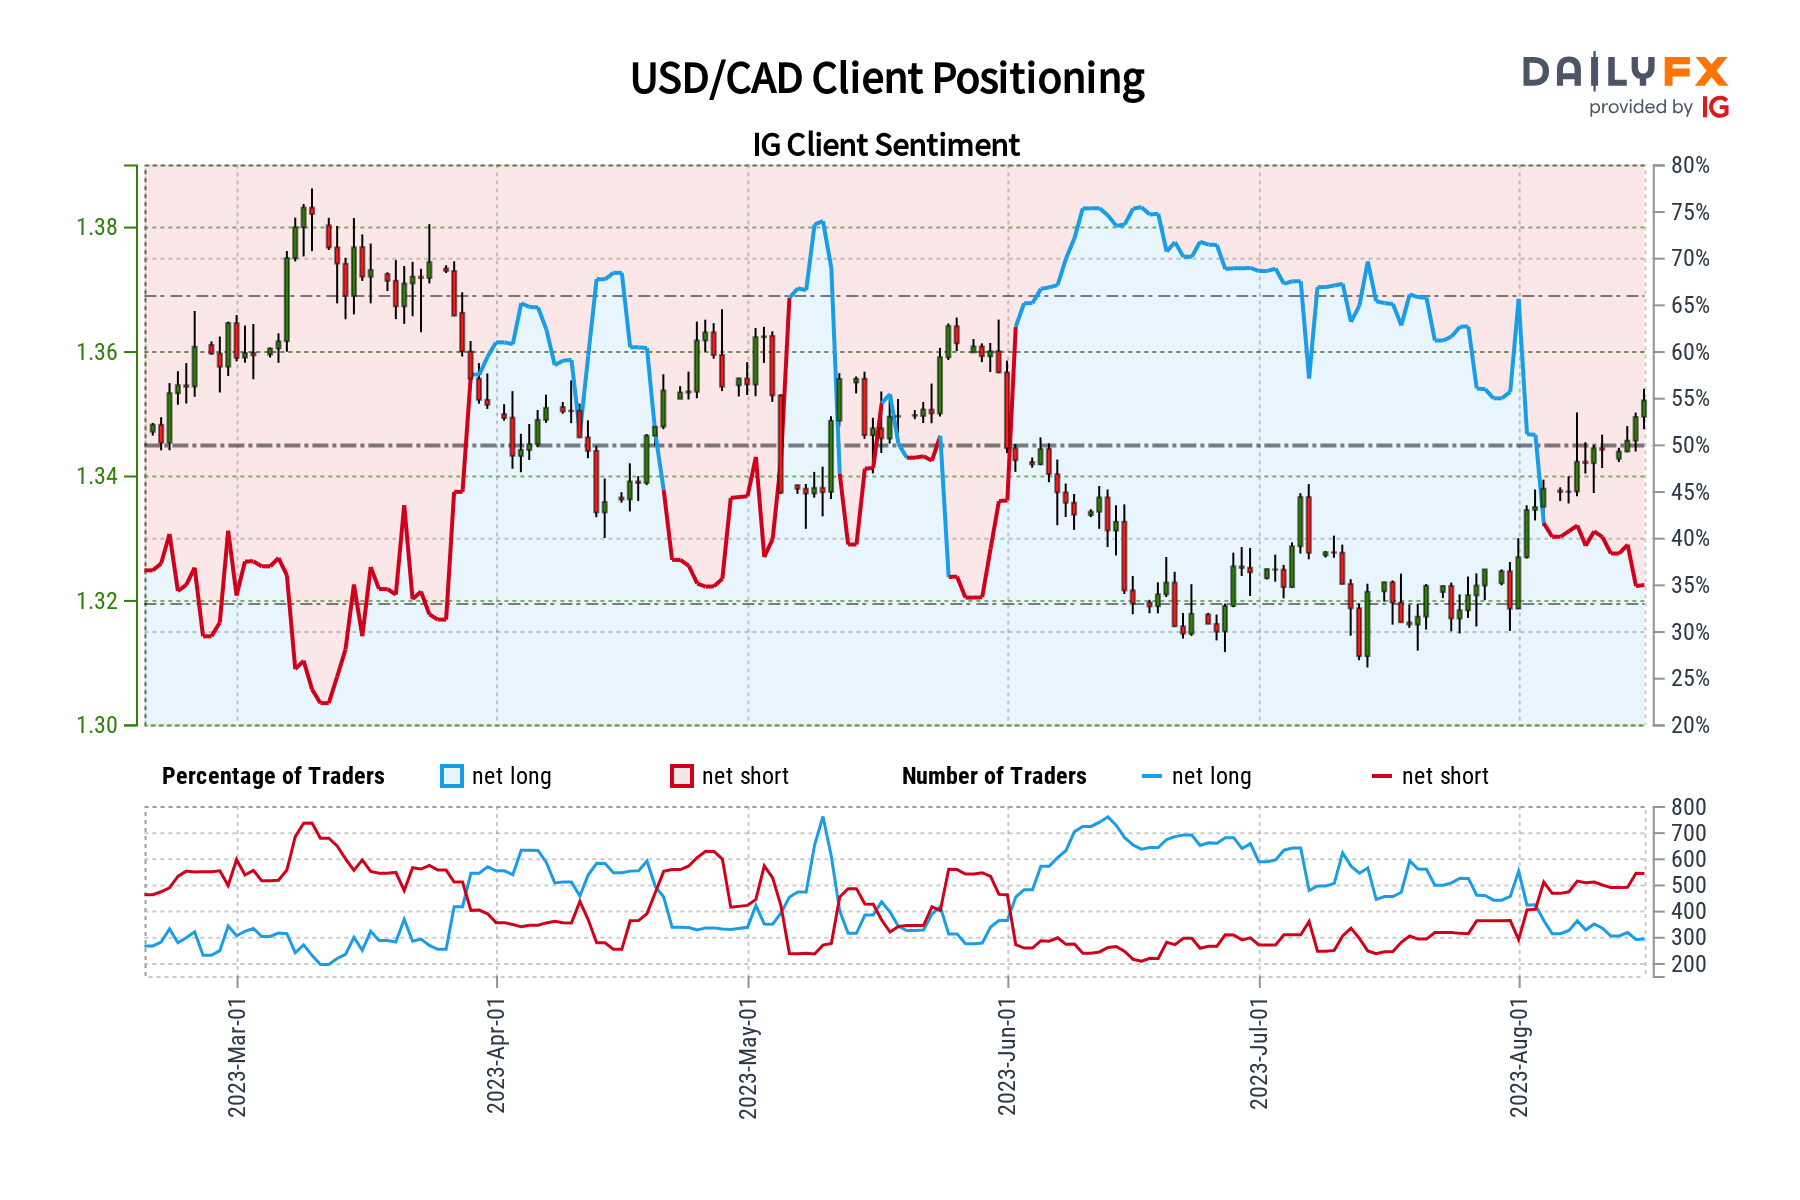
The IGCS gauge shows that only 36% of retail traders are net-long USD/CAD. This is the least amount of upside exposure since late May. Since most bets are on the downside now, this hints that prices may continue rising. This is as upside exposure decreased by 3.81% and 17.66% compared to yesterday and last week, respectively. With that in mind, the overall landscape of exposure offers a stronger bullish contrarian trading bias.
| Change in | Longs | Shorts | OI |
| Daily | -2% | -1% | -1% |
| Weekly | -18% | 3% | -5% |
Canadian Dollar Daily Chart
On the daily chart below, USD/CAD has confirmed a breakout above the falling trendline from March. This is offering an increasingly bullish technical bias. From here, immediate resistance is the 61.8% Fibonacci retracement level at 1.3568. A confirmatory upside push from there subsequently places the focus on the April high of 1.3668.
In the event of a turn lower, immediate support appears to be the midpoint of the Fibonacci retracement level at 1.3477. Just below that is that former falling trendline, which could hold as new support. If not, extending a drop through the trendline offers an increasingly bearish technical bias, opening the door to a revisit of the 1.3093 – 1.3139 support zone.
Recommended by Daniel Dubrovsky
What are the fundamentals of breakout trading?
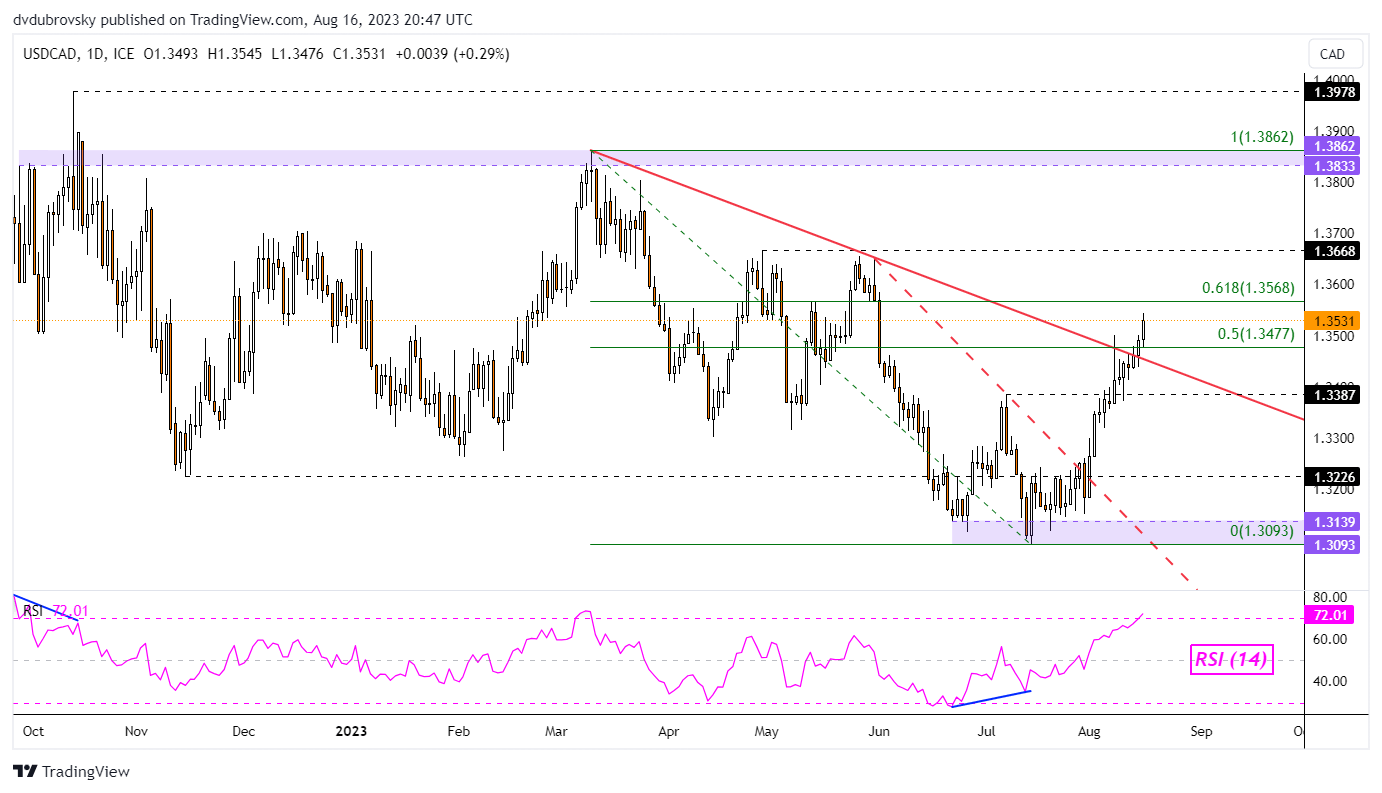
Chart Created in Trading View
— Written by Daniel Dubrovsky, Senior Strategist for DailyFX.com

 آموزش مجازی مدیریت عالی و حرفه ای کسب و کار DBA


ارسال نظر شما
مجموع نظرات : 0 در انتظار بررسی : 0 انتشار یافته : 0