Gold, XAU/USD, Trendline, Death Cross – Technical Update:
- Gold prices have fallen to a key rising trendline from February
- A breakout could mark the beginning of a broader bearish bias
- The 4-hour timeframe has a bearish Death Cross in focus
Recommended by Daniel Dubrovsky
Get Your Free Gold Forecast
Daily Chart
Following cautious losses since the middle of July, gold now finds itself sitting right on the rising trendline from February – see chart below. Clearing this line could open the door to an increasingly bearish technical bias. That exposes the 38.2% Fibonacci retracement level at 1903, which is also closely aligned with lows from June.
Furthermore, a bullish Golden Cross between the 20- and 50-day Moving Averages (MA) is being undermined by recent price action. If losses continue, this would have turned out as a false signal. As such, the yellow metal could soon be on the verge of a broader reversal when looking back to upside progress made between November through early May.
With that in mind, let us take a closer look at the 4-hour time frame to see how the near-term technical landscape is shaping up.
Chart Created in TradingView
4-Hour Chart
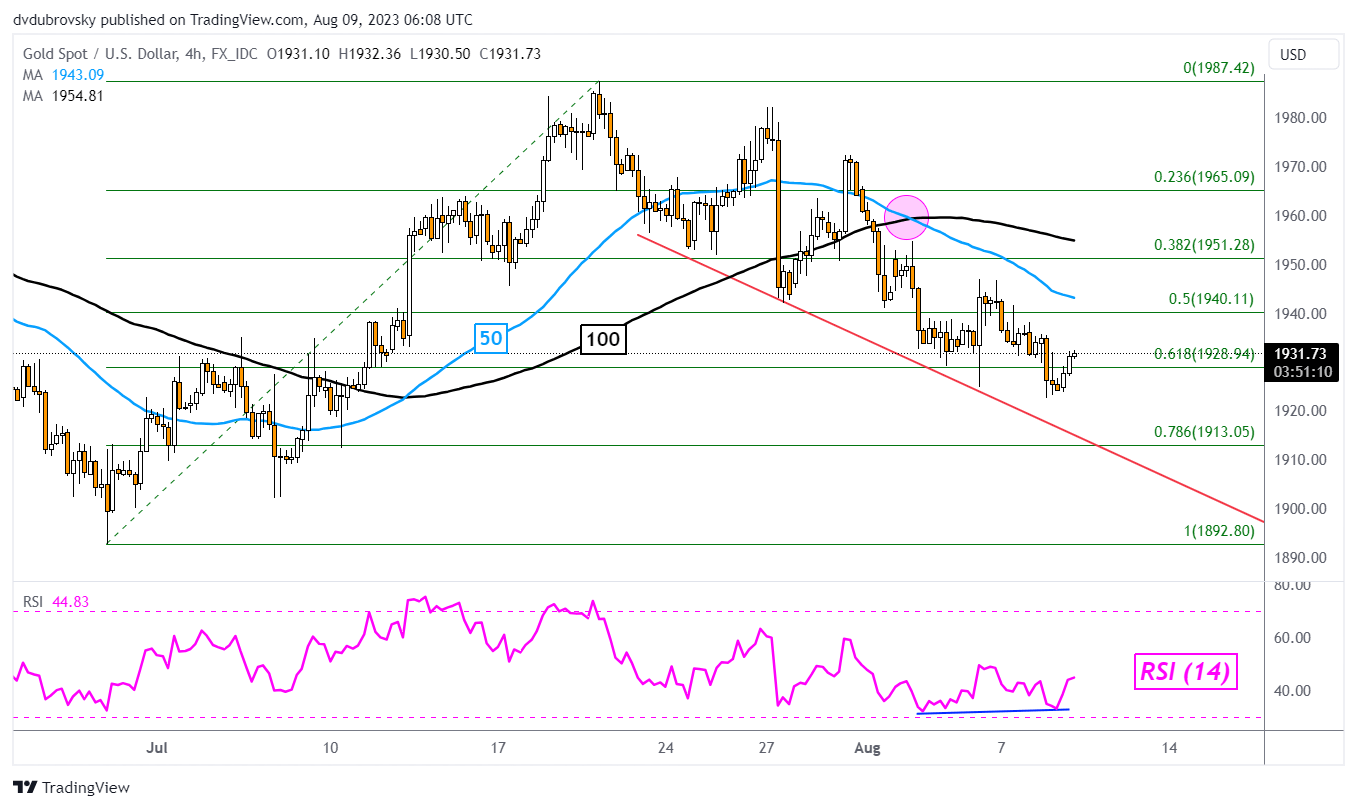
On the 4-hour chart below, the near-term downtrend can be seen better. A descending trendline seems to be holding as support, offering a steady descent. Meanwhile, a bearish Death Cross between the 50- and 100-period Mas formed towards the beginning of this month, hinting at downside price action to come.
Positive RSI divergence does appear to be showing that downside momentum is fading. This is as XAU/USD tests the 61.8% Fibonacci retracement level in this timeframe. But, it would likely take breaching above the 50- and 100-period MAs to reinstate a near-term bullish technical perspective. Such a case places the focus on the 23.6% level at 1965 before the July high of 1987 kicks in.
Recommended by Daniel Dubrovsky
How to Trade Gold

Chart Created in TradingView
— Written by Daniel Dubrovsky, Strategist for DailyFX.com


 آموزش مجازی مدیریت عالی و حرفه ای کسب و کار DBA


ارسال نظر شما
مجموع نظرات : 0 در انتظار بررسی : 0 انتشار یافته : ۰