British Pound Vs US Dollar, Euro, Japanese Yen – Price Setups:
- BOE rate hike could trigger a minor rebound in GBP/USD.
- EUR/GBP’s rebound appears to be running out of steam.
- What is the outlook on key GBP crosses and what are the key levels to watch?
Recommended by Manish Jaradi
How to Trade the “One Glance” Indicator, Ichimoku
The British pound looks set to recoup some of its recent losses after the Bank of England (BOE) raised interest rates by 25 basis points to 5.25% and didn’t rule out further tightening.
The BOE stopped short of signaling that UK interest rates are peaking. “I don’t think it is time to declare it’s all over,” Governor Andrew Bailey said. The central bank Deputy Governor Ben Broadbent said keeping relatively high rates over an extended period was key for cutting inflation. Meanwhile, financial markets continue to expect BOE terminal rate at 5.75% given price pressures are moderating less than elsewhere.
With the central bank meeting out of the way, buy-the-rumor-sell-the-fact could push up GBP, which has declined in recent days – a possibility pointed out in the previous update. See “British Pound Toppish Ahead of BOE: GBP/USD, GBP/AUD, GBP/NZD Price Setups,” published August 1.
GBP/USD 240-minute Chart
Chart Created by Manish Jaradi Using TradingView
GBP/USD: Support could hold for now
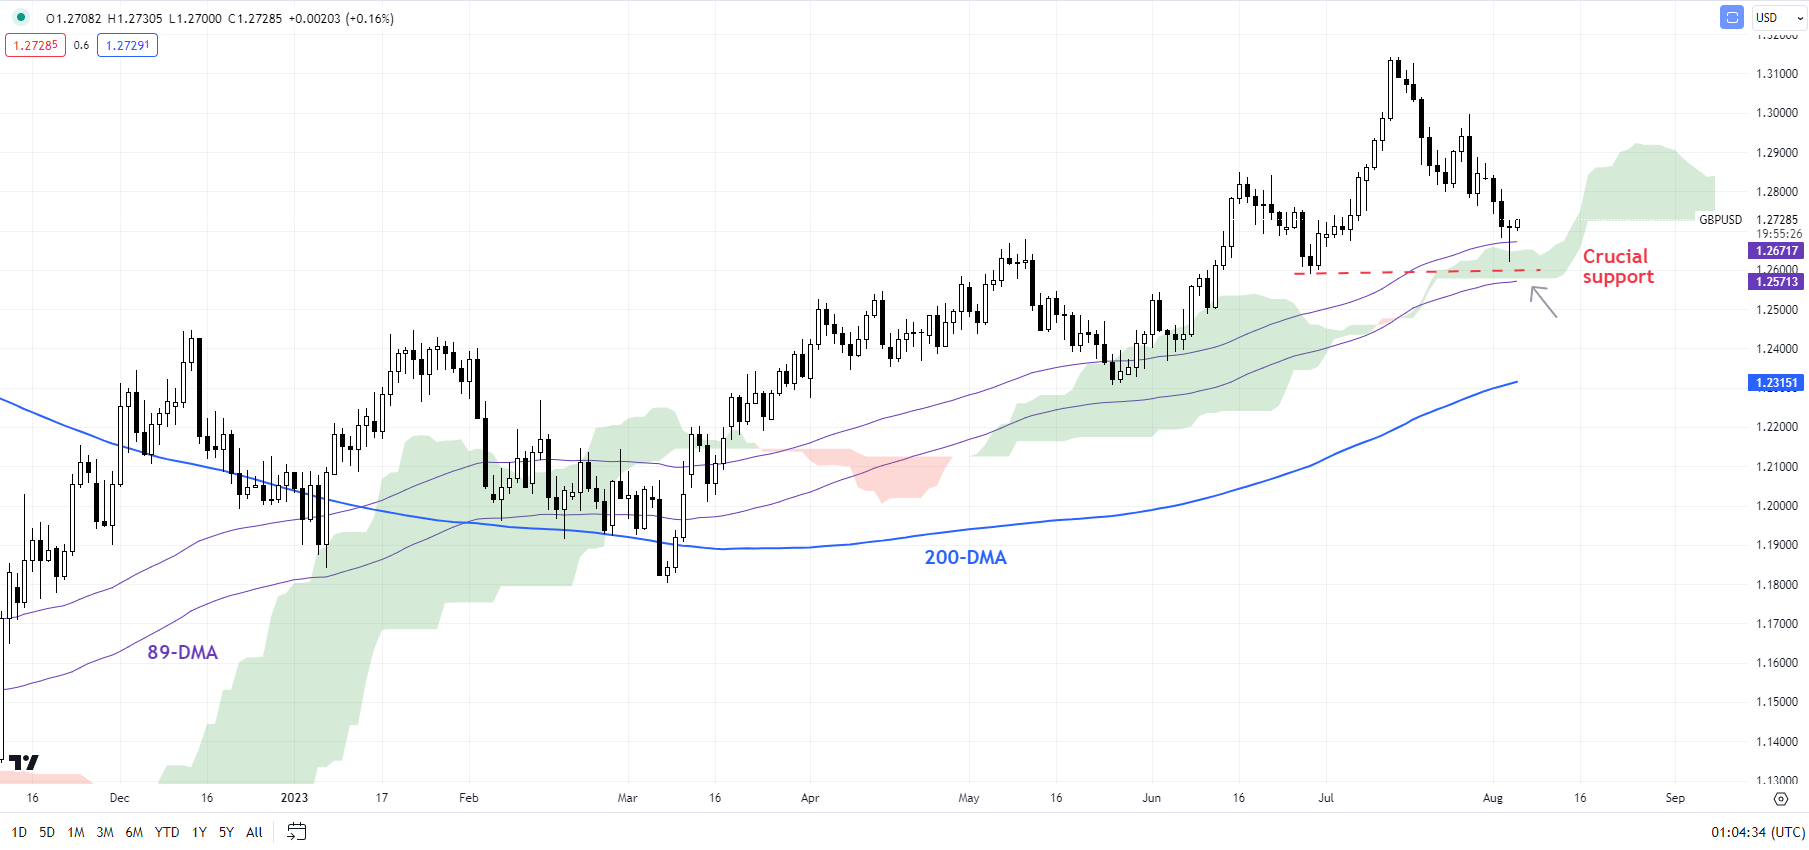
GBP/USD is testing fairly strong support at the end-June low of 1.2600. The 14-period Relative Strength Index on the 4-hourly chart is around 30 – levels that have previously led to a rebound (see chart). The support also coincides with the 89-day moving average and the lower edge of the Ichimoku cloud on the daily charts.
GBP/USD Daily Chart

Chart Created by Manish Jaradi Using TradingView
Any rebound could push cable toward a stiff resistance area around 1.2800-1.2900, including the 200-period moving average, and the 89-period moving average, roughly coinciding with a downtrend line from mid-July. For the immediate downward pressure to fade, GBP/USD needs to break above the crucial resistance area. In the absence of a break, the path of least resistance remains sideways to slightly down.
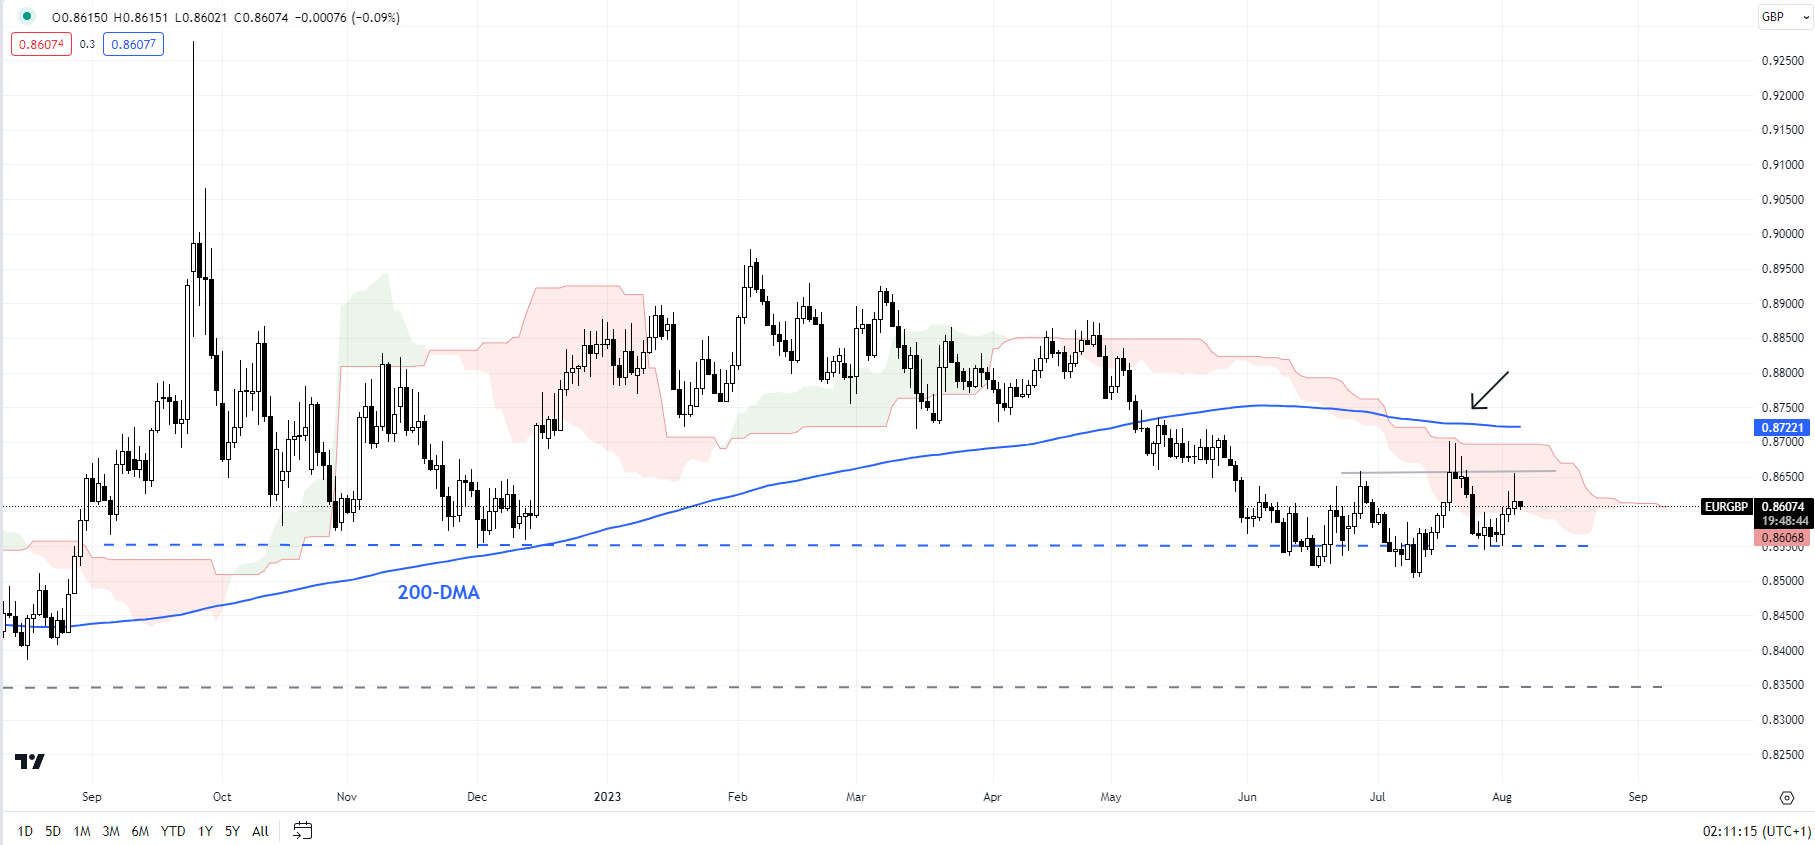
EUR/GBP Daily Chart

Chart Created by Manish Jaradi Using TradingView
EUR/GBP: Rebound is running out of steam
The failure of EUR/GBP in recent days to clear past a tough ceiling around 0.8700-0.8725 raises the risk that the consolidation/minor rebound could be nearing an end. The resistance area includes the upper edge of the Ichimoku channel on the daily chart and the 200-day moving average. Any break below immediate support at the July low of 0.8500 could open the door toward 0.8350.
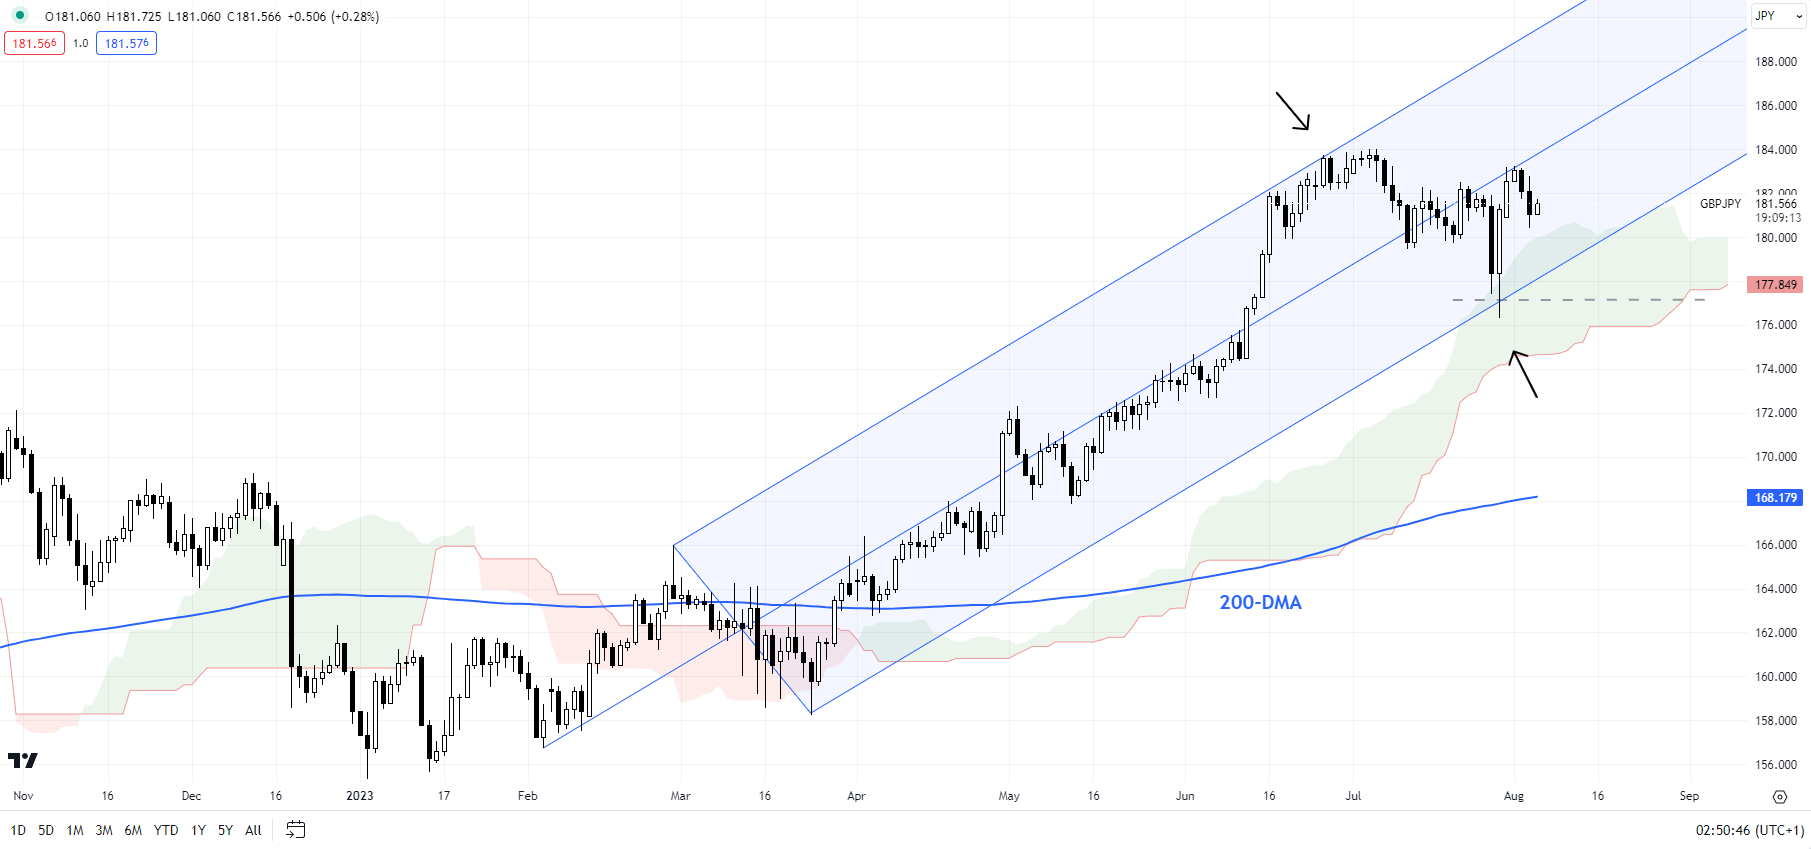
GBP/JPY Daily Chart

Chart Created by Manish Jaradi Using TradingView
GBP/JPY: Well guided by the rising channel
GBP/JPY’s slide truncated around vital support on the lower edge of a rising pitchfork channel from early 2023, near the lower edge of the Ichimoku cloud on the daily charts. Still, the cross needs to break above the immediate barrier at the July high of 184.00 for the broader uptrend to resume. In the absence of such a break, the cross could settle in a range in the short term.
Recommended by Manish Jaradi
How to Trade GBP/USD
— Written by Manish Jaradi, Strategist for DailyFX.com
— Contact and follow Jaradi on Twitter: @JaradiManish


 آموزش مجازی مدیریت عالی و حرفه ای کسب و کار DBA


ارسال نظر شما
مجموع نظرات : 0 در انتظار بررسی : 0 انتشار یافته : ۰