Gold Performance in Midterm Election Years – There’s a Bigger Trend Elsewhere
US MIDTERM ELECTIONS OUTLOOK: US midterm elections will be held on November 8 this year. Going back to 1978, the performance by gold prices before and after US midterm elections is a mixed bag. Any direct connection between gold prices and midterm elections may be spurious, at best. Recommended by James Stanley Get Your Free

US MIDTERM ELECTIONS OUTLOOK:
- US midterm elections will be held on November 8 this year.
- Going back to 1978, the performance by gold prices before and after US midterm elections is a mixed bag.
- Any direct connection between gold prices and midterm elections may be spurious, at best.
Recommended by James Stanley
Get Your Free Gold Forecast
Elections are big deals for economies, but the impact might not always be immediately clear. Traditionally, the President leads the executive branch of the government and along with Congress, that’s where decisions for fiscal policy are made. The Fed controls monetary policy, which generally speaking, has a short-term focus and a shorter-term impact. Or at least, that was the design as I learned when taking economics classes twenty years ago.
The bigger picture economic items – the tax cuts (or hikes), the stimulus plans and the infrastructure spending – that’s fiscal policy, and that rests squarely on the shoulders of those elected representatives. Over the past decade there’s been a tendency for each governmental entity to spill-over to the other, with the Federal Reserve instituting an aggressive policy of easing that has had a much longer half-life than just a year. Congress, on the other hand, questions the Fed about the massive balance sheet that they’ve built and why they were so slow to raise rates in 2021.
All of this plays out in the political spectrum which, in-turn, plays out in capital markets. And given Gold’s role in the global economy, many of these themes will often play out in the world’s most precious of precious metals. These relationships aren’t always linear, unfortunately, and there’s often a considerable amount of context around markets going into each election.
In this article, I’m going to examine Gold prices in midterm election years going back to 1978. I’m going to look at Gold performance in the ten months leading into the election as well as the two years after, leading into the next general election. So, the election year performance is from the year’s open to the October 31st close; and the two year post election performance is from the October 31st close of the year of the midterm, to the October 31st close two years after, which is just ahead of the next general election.
Given the incredibly small sample size, each iteration will be accompanied with a description of the backdrop at the time in effort of providing that much needed context mentioned above.
Gold Performance Ahead of Midterm Elections
In terms of gold performance leading into midterm elections, there’s a possible pattern to work with as the move in gold returns from 1990 into 2010 is notable, given the -4.91% performance in gold in 1990, which continued to improve through each midterm election during the 20-year period after.
Of course, this 20-year period ushered in some of the greatest innovation ever seen with the internet taking over the world in a number of ways. Much of this was funded by relatively low rates that helped to drive investment and, in-turn, investment markets. Gold benefited from this, even if the impact wasn’t always directly noticeable.
The question then is whether it was midterm elections that were creating the trend or whether there was something else going on? And given that the trend persisted through multiple elections when the House and Senate and Presidency were all changing parties, it would seem that any direct connection to midterm elections would be spurious, at best.
The greater drive here would seem to be the evolution that’s taken place at central banks, and more pointedly, the Federal Reserve. Given central bank policy moving towards a state of extreme accommodation since 1990, the trend exhibited in the data below would appear to share a key relationship with that. The 90’s and 00’s led to one of the greatest boom and bust periods ever seen in modern financial markets. A driving force along the way, of course, was FOMC policy, and this had an impact in gold prices as markets adjusted to this new central bank regime.
Gold returns in midterm election years (January-October 31st)
Chart prepared by James Stanley
Gold Performance After Midterm Elections
Gold returns in the 2 years after midterm elections appears to be more random to me. There was a massive move after the 1978 election and that was largely driven by the staglation environment of the late-70’s and early-80’s, just as Paul Volcker was coming into the picture. This seems to obscure the remaining body of data. But, let’s look at it both ways to see if we can spot a trend.
Gold Performance Two Years After Midterms
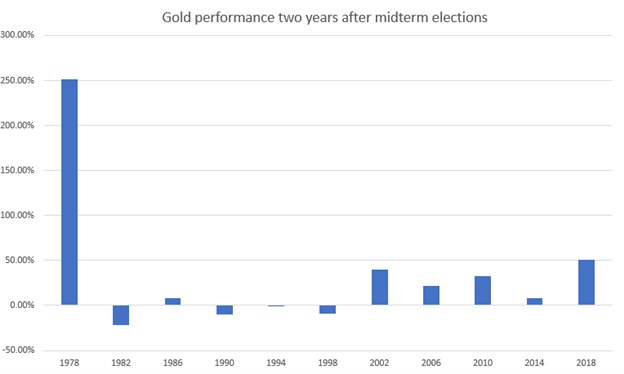
Chart prepared by James Stanley
And if we strip out that massive move after the 1978 elections, we’re left with a cleaner body of data, and a similar albeit less defined trend shows compared to what we had looked at in our first chart.
Gold performance two years after midterm elections, excluding 1978
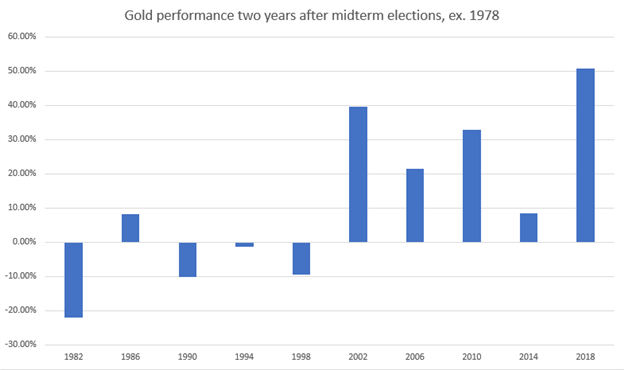
Chart prepared by James Stanley
Synopsis of the Data
There does seem to be something that’s impacted gold prices over the past 44 years but, from this study it does not appear to be a midterm election issue, or even a general election issue. The more pressing likelihood is that its an evolution in central banking and the willingness of central banks to take on massive amounts of debt on the balance sheet, which serves to increase the money supply while, in essence, devaluing fiat currencies.
But, because currencies are all relative valuations (the only way to value a currency is with another currency), that impact might not be so clear if we’re comparing two assets that are declining in value at the same time given increased supply. But, if we compare that currency to an asset that isn’t seeing similar depreciation, well that change can be much more prominent and that appears to be a workable theory as to what’s going on here.
Below, I go through each midterm election going back to 1978 to provide a bit of anecdotal color to the body of data looked at above.
1978
The 1978 midterm election took place in the middle of US President Jimmy Carter’s only term in office. The political backdrop at the time remained murky, with Carter having won against Gerald Ford, who had taken over for Richard Nixon after he was impeached from office in 1974 with two years remaining on his term.
Democrats retained control of both the House and the Senate in the 78 midterms and this was the last time that Democrats had a government trifecta, controlling both houses of Congress as well as the White House.
Elections were held on November 7th and Gold prices were very much on the move around this theme: Gold had gained as much as 46.79% from the 1978 open to the high on October 30th. That high printed just inside of the $250 level on October 30th, after which a massive spike-down showed on October 31st. The New York Times ran an article titled ‘What’s Behind the Gold Rush?’ in August of that year, illustrating this building mania throughout the year as investors were flocking into precious metals.
More interesting is what happened in November of that year as the bubble that built throughout the year had started to give way to sellers. Gold prices fell through the month of November, eventually hitting a low more than 23% away from the October high.
In the lead-up to the midterm in 1978, gold prices gained 26.55%, and then went on to gain a whopping 251.32% in the 2 years after.
Gold Performance Ahead of 1978 Midterms
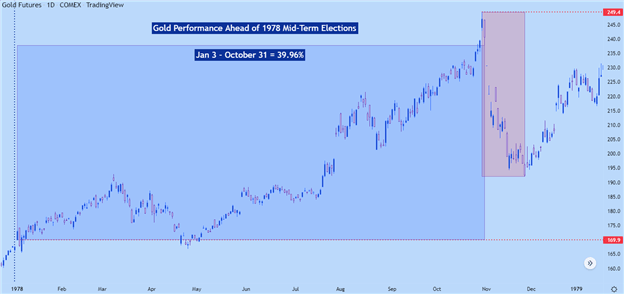
Chart prepared by James Stanley; Gold on Tradingview
The two years after the 1978 midterms were especially friendly to Gold bulls. This is also when inflation was growing rapidly in the United States, with CPI at 11.3% for 1979 and then 13.5% for 1980. The Fed would start their aggressive rate hikes under the stewardship of Paul Volcker, who took over the top spot at the FOMC in 1979. This was aimed at tempering inflation and it eventually worked. Along the way, however, some massive market moves showed up.
Gold gained as much as 355% from the November 1978 low up to the January 1980 high. A whopping figure by any account. But, perhaps more so when we consider what happened after…
1982
By 1981 Paul Volcker had hiked rates somewhat aggressively in the US economy and this had already started to temper inflation, with CPI in 1981 falling to 10.3% from the 13.5% in 1980; and even more encouragement in 1982 when CPI came in at 6.1%.
Volcker’s strategy was working, and the stagflation that plagued the US economy for much of the 70’s was finally being addressed.
However, with interest rates so high, Gold wasn’t a very attractive investment, all factors considered. Investors could get 10% or more from relatively low risk investments like CDs (Certificates of Deposits, not Compact Discs as those were still a few years away). Naturally was going to attract a lot of capital: It was Volcker’s plan, after all, to drain excess reserves from the system and the way to do that is attracting capital with higher rates.
Gold prices technically gained from the January open into the October 31st close, but it was a small sum of 4.77%.
The two years after that election were especially painful, with gold prices losing -21.97% in the two years after. Again, the effect of restrictive monetary policy was on full display during this period.
Gold Performance – 1982 Midterm Elections
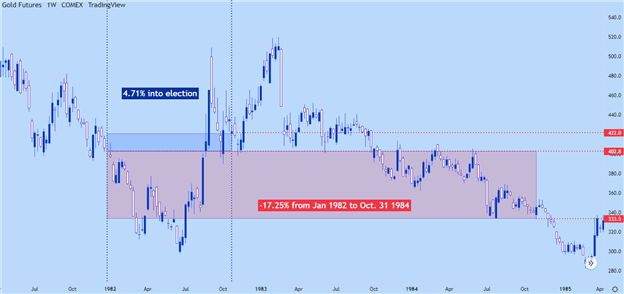
Chart prepared by James Stanley; Gold on Tradingview
1986
The Walkman had been released and hip hop had started to hit the airwaves. By 1986 inflation had fallen back to more reasonable levels if not perhaps a bit too low for the Fed’s liking. CPI in 1986 was at 1.9% and Ronald Reagan had won a second term as President in 1984, with considerable help from a strong economy.
Nonetheless, Democrats won back control of the Senate for the first time since the 1980 election while gaining five seats in the House.
Gold performance was strong that year, with the first traded price of 329.80 leading into a spike up to a high of 446.5 in October of that year. That high was set on October 8th, 1986 and accounted for a move of up to 35.39%.
But, very similar to what showed up in 1978, prices sold off aggressively into the month of the election and through the election itself. The closing price on October 31, 1986 was at 405.40, so more than $40 off of the high that was set earlier that month. This makes for a total gain of 22.95% leading into the election that year.
And the two year window after that election again resembles the 1978 iteration, in which the November dip led to a low that held as bulls returned to the equation.
Gold Performance Ahead of 1986 Midterm Elections
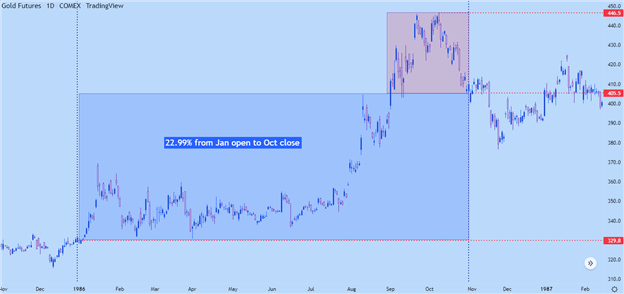
Chart prepared by James Stanley; Gold on Tradingview
Post Midterm Performance
After that dip in November of 1978, bulls sparked a strong trend that ran through 1987, even as the Savings and Loan debacle started to hit US capital markets. From the November low up to the December 1987 high, Gold prices gained as much as 34.48%.
The first 10 months of 1988 were not so friendly, however, as Gold gave back a large portion of that gain and ended October of 1988 at a price of 423.50.
1990
By 1990 inflation had started to return to the United States. We were half-way through the first and only term of George HW Bush and this is the year that Iraq invaded Kuwait, setting off a cascade of events that remains relevant today. CPI for 1990 came in at 5.4%.
Democrats held a majority in both the House and Senate ahead of 1990 midterms and they picked up seats in each branch. The Senate saw only one seat change parties and Democrats gained seven seats in the House.
Gold prices first traded at 401.00 to kick off 1990 and it was a volatile year, as prices spiked up to 425 before falling down to $350/oz in June. By October 31st, the loss had pared as prices closed the month at 381.30, making for a loss of -4.91% going into that election.
Gold Performance into the 1990 Election
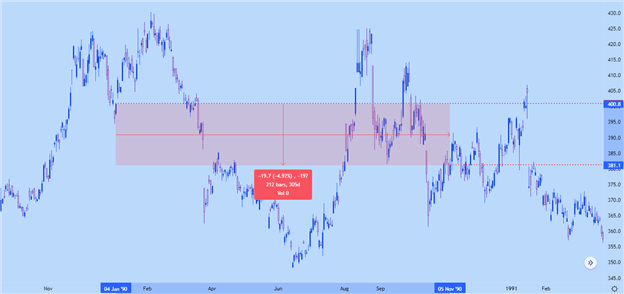
Chart prepared by James Stanley; Gold on Tradingview
The two years after the 1990 election were similarly poor, with Gold moving down to $340.10/oz ahead of the 1992 general election. Notably, this all took place amidst backdrop of falling rates, as the Fed cut rates from 8% in early 1990 to 3% in September of 1992, ahead of that general election.
That did little to help gold prices, however, at least ahead of the 1992 general election, in which a Governor from Arkansas by the name of William Clinton unseated George Bush. The two year post-midterm election performance was -10.27%.
1994
This was in the middle of Bill Clinton’s first term. The Fed was hiking again in 1994 after a series of cuts. CPI settled at 2.6% for the year. Equities were roughly flat through the period, but this led to one of the strongest bull markets on record (at the time) when the S&P 500 gained for 17 out of 19 months from December 1994 into July of 1996.
With rates relatively low and with inflation in-check, the environment was ripe for innovation as computers and the internet started to gain wider acceptance, which helped to contribute to that massive bull market in stocks.
Gold performance did not mirror that. Gold was range-bound for much of the year. The first trade in 1994 was at 391.90 and the last trade on October 31 was at 383.7, for a total loss of -2.09%. The two years after provided a flare of excitement but, again, a general tendency to range with gold closing October of 1996 with a -1.33% return in that two-year post-midterm window.
Gold Performance Around the 1994 Midterm Elections
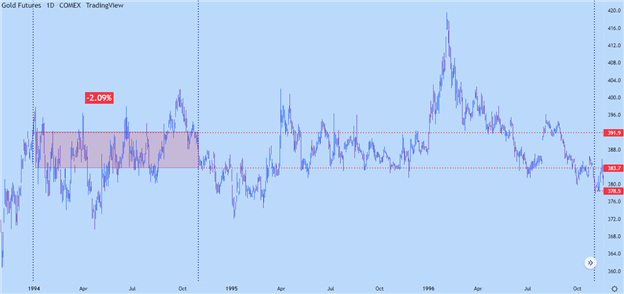
Chart prepared by James Stanley; Gold on Tradingview
1998
The internet boom was in full bloom in 1998, and this midterm election saw Republicans retain both chambers of Congress. Democrats did gain ground in the house despite the majority remaining on the GOP side of the equation.
In markets – equities ripped in the first-half of the year and tanked in July and August, losing as much as 22% on the S&P 500. Support held in October and prices rallied through the election and eventually, through the end of the year and most of 1999 before topping-out in 2000, just a couple of months ahead of the general election that taught the world about ‘hanging chads.’
Gold had a very muted year of performance, after opening at 289 and rallying up to 293 at the October close. There was some interim volatility, however, as a 10% move developed into April, which was then followed by a 13.6% sell-off into August. Price settled going into the election that year, but what happened after remains a notable show of volatility…
In the summer of 1999, gold prices broke-down to a low of 253, which was then followed by an aggressive spike up to the 339 level for a total move of more than 33% in just a few short months. More volatility was in store through the year 2000, as the tech theme was starting to top, and a bearish trend took-hold again in the summer of 2000 and remained into the general election that year.
Leading into the 1998 elections, gold prices gained 1.49%, and then lost -9.43% in the two years after.
Gold Performance Ahead of 1998 Midterm Elections
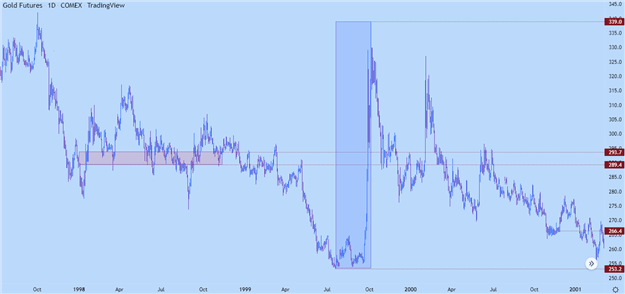
Chart prepared by James Stanley; Gold on Tradingview
2002
Matters had calmed a bit in gold as the door opened into 2002. Not so much in equities, however, as the tech bust remained in working order. The world had just come off of the 9/11 attacks, as well, and there was the prospect of greater and greater government spending as the world went to war.
The Fed had cut rates aggressively in 2001, moving Fed Funds down to 1.75% in December after coming into the year at 6%. This reflected in gold prices going into the election as a rather smooth bullish trend had developed in 2001 that continued through much of 2002.
After opening the year at 279.50, prices rallied up to 318.40 to close October, with a really strong move continuing in the two years after. Ahead of the 2004 general election, gold prices closed that October at 429.40.
This was a pretty clear response to those rate cuts in 2001 that set the tables for the housing boom, which eventually created the financial collapse. This created a 53.47% move from the 2002 open to the October 2004 close.
For overall performance – gold added 13.92% ahead of the 2002 election, helped along by the Fed’s rate cuts, with a whopping 39.71% in the two years after that election.
Gold Performance Ahead of 2002 Election
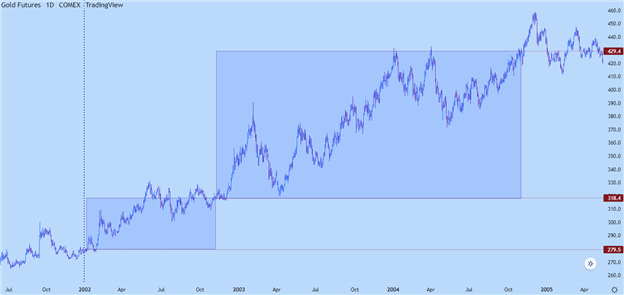
Chart prepared by James Stanley; Gold on Tradingview
2006
The 2006 elections brought a ‘blue wave’ to the US, with Democrats winning control of both houses of Congress. Rates were on their way up at the time, as the Fed was addressing some of the froth that had been seen in the housing market.
And the culprit for that – may be the fact that the FOMC left rates at 1% flat for over a year from May of 2003 through May of 2004.
But, when the rate hikes came in, they were fairly consistent from the summer of 2004 through the summer of 2006, eventually rising to a Fed Funds rate of 5.25% in June of 2006.
Gold was very volatile along the way, spiking by more than 40% in the early part of 2006, eventually topping out around $732 in May of that year. That was followed by a steep slide into June, a couple of weeks before that final rate cut of the year.
The financial collapse started to show up in the two years after and this created even more volatility. Gold rose to test above the $1k figure. That amounted to a 100% run from the 2006 open.
But, that was followed by a rather dramatic drop as the financial collapse took over, with a -34.13% dip from March of 2008 to October of 2008.
For overall performance – gold prices gained 16.71% leading into the election that year, with another 21.43% in the two-year window after.
Gold Performance Ahead of the 2006 Midterms
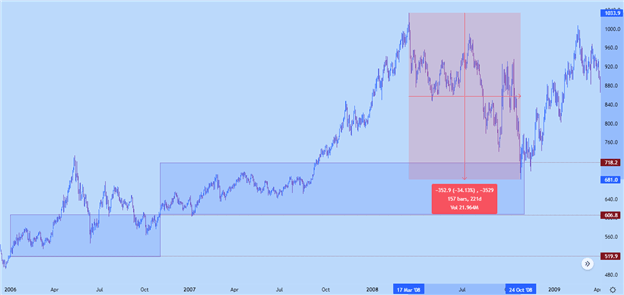
Chart prepared by James Stanley; Gold on Tradingview
2010
By 2010 the Federal Reserve had already started their extreme accommodation in the wake of the financial collapse, and this involved the use of both low rates and Quantitative Easing. Rate hikes weren’t even in the equation at the time, even with growth coming back online, and this was something that showed visibly in gold prices.
As for the election, Republicans picked up seven seats in the Senate but remained a minority, while they won a whopping 63 seats in the House which is the most that any party had gained since the 1948 elections.
Gold price were bullish for much of this period, helped along by that uber-accommodation from the FOMC. Gold gained 23.85% from the 2010 open into the October close. And much of that strength remained ahead of the 2012 general election, for another 32.98% move in the two years after.
Gold Performance Around of the 2010 Election
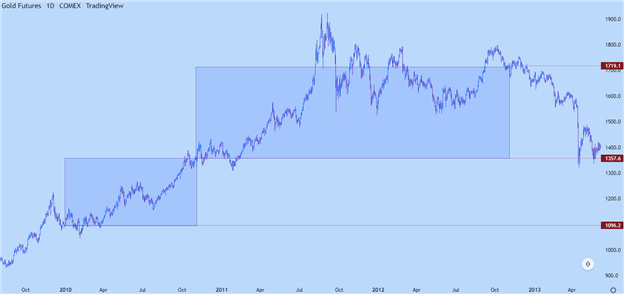
Chart prepared by James Stanley; Gold on Tradingview
2014
This midterm took place in the middle of Barrack Obama’s second term in office. Republicans retained control of the House and won control of the Senate. Stock markets remained strong, helped along by the Fed who still hadn’t adjusted rates since the Financial Collapse.
Gold prices, however, appeared to be trying to look around the next corner in anticipation of as such, as gold continued to sell-off after setting a high in 2011.
The year started with a flare of hope for gold bulls. That had dissipated by the time the election rolled around and gold was at a net loss for the year before voters went to the polls. That bearish trend continued in the year after, as well, with a low eventually showing around the 2016 open.
Gold prices were strong in the first half of the year and started to give back some of the trend in the second. Price closed October of 2016 at 1273, reflecting a net gain in gold from the 2014 open. But, that gain quickly went away in the months after that election.
Gold performance leading into the 2014 midterm election was -2.55%, and 8.44% in the two years after.
Gold Performance Around the 2014 Midterm Election
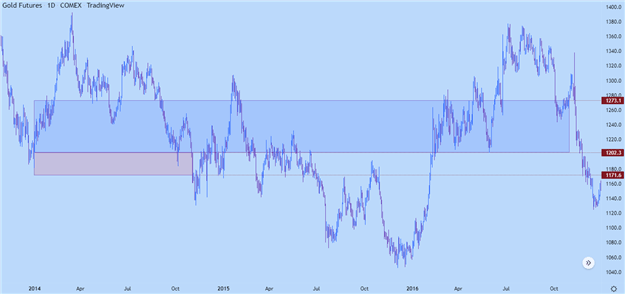
Chart prepared by James Stanley; Gold on Tradingview
2018
This midterm was being widely-billed as a referendum on Donald Trump as this took place in the middle of his term. Republicans had a governmental trifecta going into this election, with control of both the House and Senate to go along with the Executive branch of the government.
Democrats gained control of the House in this election while Republicans retained control of the Senate. This was the highest voter turnout in a midterm election since 1914 with 49.4% of registered voters hitting the polls.
As far as markets are concerned, the S&P 500 was buoyant and the Fed had already started hiking rates aggressively a year earlier, in 2017. After rates were hiked just twice in the previous nine years, with the last rate cut at the time all the way back in 2007, the Fed made a massive move by hiking three times and 75 basis points in 2017. In 2018, the bank remained extremely aggressive, hiking another four times. After the third hike that year, markets began to sell-off, for fear of the Fed over-tightening. At the December rate decision that year, the Fed forecasted another two hikes in 2019. But, the bank ended up cutting three times instead, creating another swell of strength in the equity trade.
In 2018, as the Fed was hiking aggressively, gold prices retained a bearish trajectory, opening the year at 1309.30 and ending October of that year at 1215.
The two years after, however, were a far different story as gold prices exploded on the back of the Fed’s uber-dovish turn. The bank cut thrice in 2019 but they moved to uber-accommodation around Covid, which created a massive swell in gold prices ahead of the 2022 election.
Gold lost 7.2% going into the 2018 election, driven-lower by continued FOMC rate hikes; but then a massive 50.78% return showed up in the two years after, helped along by the Fed’s 2019 rate cuts and then the stimulus that was triggered around the pandemic.
Gold Performance Around the 2018 Midterm
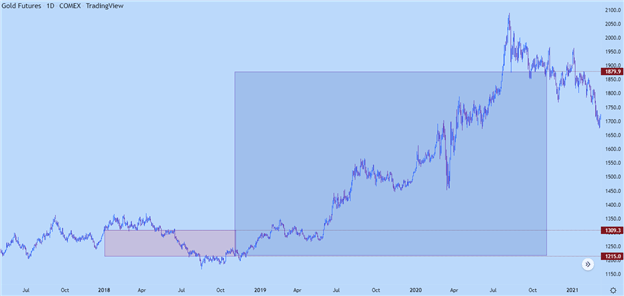
Chart prepared by James Stanley; Gold on Tradingview
Trade Smarter – Sign up for the DailyFX Newsletter
Receive timely and compelling market commentary from the DailyFX team
Subscribe to Newsletter
— Written by James Stanley, Senior Strategist, DailyFX.com & Head of DailyFX Education
Contact and follow James on Twitter: @JStanleyFX
 آموزش مجازی مدیریت عالی حرفه ای کسب و کار Post DBA آموزش مجازی مدیریت عالی حرفه ای کسب و کار Post DBA+ مدرک معتبر قابل ترجمه رسمی با مهر دادگستری و وزارت امور خارجه |  آموزش مجازی مدیریت عالی و حرفه ای کسب و کار DBA آموزش مجازی مدیریت عالی و حرفه ای کسب و کار DBA+ مدرک معتبر قابل ترجمه رسمی با مهر دادگستری و وزارت امور خارجه |  آموزش مجازی مدیریت کسب و کار MBA آموزش مجازی مدیریت کسب و کار MBA+ مدرک معتبر قابل ترجمه رسمی با مهر دادگستری و وزارت امور خارجه |
 مدیریت حرفه ای کافی شاپ |  حقوقدان خبره |  سرآشپز حرفه ای |
 آموزش مجازی تعمیرات موبایل آموزش مجازی تعمیرات موبایل |  آموزش مجازی ICDL مهارت های رایانه کار درجه یک و دو |  آموزش مجازی کارشناس معاملات املاک_ مشاور املاک آموزش مجازی کارشناس معاملات املاک_ مشاور املاک |
- نظرات ارسال شده توسط شما، پس از تایید توسط مدیران سایت منتشر خواهد شد.
- نظراتی که حاوی تهمت یا افترا باشد منتشر نخواهد شد.
- نظراتی که به غیر از زبان فارسی یا غیر مرتبط با خبر باشد منتشر نخواهد شد.


ارسال نظر شما
مجموع نظرات : 0 در انتظار بررسی : 0 انتشار یافته : ۰