5 MT4 Indicators That Can Improve Your Trading Win Rate
Trading is a game of probabilities. It is all about who gets to win bigger gains compared to the losses, or who gets to win more often rather than losing. Traders call the former as the risk-reward ratio, and the second one as the win rate. Traders who could statistically get a good mix or

Trading is a game of probabilities. It is all about who gets to win bigger gains compared to the losses, or who gets to win more often rather than losing. Traders call the former as the risk-reward ratio, and the second one as the win rate. Traders who could statistically get a good mix or risk-reward ratio and a good win rate could gain profits over the long run.
Most traders look to be consistently profitable. The best way to be consistently profitable is to have a good win rate. This means improving your trading accuracy in order to increase your winning percentage.
One way to increase your win probability is to incorporate a high probability technical indicator in your trading plan. If you are looking for a high probability technical indicator which can help you increase your win rate when trading on an MT4 platform, then you have come to the right place.
In most cases, free technical indicators are posted online without much detailed analysis about how the indicator works. As a result, only a few actually learn to use it.
Here, we will introduce 5 high probability technical indicators that are used on an MetaTrader platform, along with a detailed analysis on how each technical indicator works.
Trend Indicators and Oscillator Indicators
There are two types of technical indicators that can provide traders with a clear indication regarding the probable direction of the market – Trend Indicators and Oscillator Indicators.
Trend Indicators are technical indicators that primarily indicate the general direction of the market, whether it is in an uptrend or in a downtrend. In a trending market, trend indicators are very valuable as it significantly increases the win probability of a trend following strategy. In many cases, trend indicators may also be used to signal trend reversals which could also be a very profitable type of trading strategy.
Oscillator Indicators on the other hand is a type of technical indicator which plots a separate line, histogram or any charting method which could show the indicator oscillating around a midline. In some cases, these oscillators can move freely and unbound by a range, while in some indicators the oscillator is bound within a fixed range. Oscillators can also be used to identify momentum and trend. However, oscillators were primarily developed in order to help traders identify overbought and oversold market conditions, as these overextended market conditions are prime conditions for a mean reversal, which could also develop into a full-blown trend reversal.
Top Trend Type Indicators
- Alert SMA-EMA
- SHI_Channel_Fast
- Fibo
Top Oscillator Type Indicators
- Stochastics Oscillators
- Relative Strength Index
Alert SMA-EMA Indicator
The Alert SMA-EMA indicator is a trend following technical indicator which is based on a pair of underlying moving average lines.
A moving average line is a line plotted based on an average value calculated from prices over a preset period of time. For example, if the moving average line is preset at 10 period, the closing value for the last 10 candlesticks are averaged. This average number represents a point on the price chart which would connect the moving average line.
Alert SMA-EMA is based on an underlying computation of an SMA and EMA line to forecast future trend directions.
SMA stands for a Simple Moving Average. This is the most basic form of a moving average line. It basically sums up the total figures and divides it by the number of periods used.
EMA on the other hand represents an Exponential Moving Average. This form of a moving average line modifies its underlying moving average computation. It places more weight on the most recent price data compared to former periods in order to make the moving average line more responsive.
One of the ways many traders identify trends and trend reversals is by observing for the crossover of moving average lines.
The Alert SMA-EMA indicator is based on this concept. It provides entry signals based on such reversal indications. It also conveniently includes an alert to notify traders of a trend reversal signal. This makes the Alert SMA-EMA indicator very useful in observing for possible trend reversal scenarios.
Unlike the common practice of using moving average lines alone, Alert SMA-EMA plots an arrow to visually help traders identify the actual reversal point and the direction of the trend reversal, making it easier for beginners to use.
Advantages of Alert SMA-EMA
- The entry signal is easily identified by an arrow making it easier for beginners to recognize.
- The confirmation of a turning point of a trend reversal can help traders make objective trade decisions with confidence.
Disadvantages of Alert SMA-EMA
- Unpredictable market conditions and market fluctuations may cause price to move in the opposite direction relative to the forecast.
The Alert SMA-EMA should be used just as a confirmation of a previously decided trade direction. In other words, it is best used as an entry signal. The forecasted signals indicated by the Alert SMA-EMA indicator is not 100% accurate, thus it is also necessary to find confluences and confirmations based on other trade analysis.
Alert SMA-EMA Best Practices
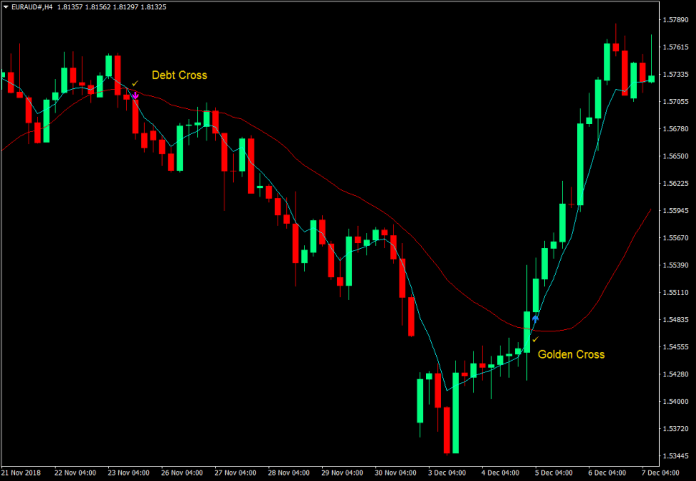
Two of the better trade setups which can be identified using the Alert SMA-EMA indicator are the Golden Cross and the Debt Cross.
Golden Cross
- The short-term moving average line crosses the long-term moving average line from bottom to top.
- This indicates a buy entry signal and is indicated by a blue arrow.
Debt Cross
- The short-term moving average line crosses the long-term moving average line from top to bottom.
- This indicates a sell entry signal and is indicated by a red arrow.
How to Set Alert SMA-EMA
Recommended Setting Values
- SMA Period: 21
- EMA Period: 5
- Time Frame: 240
- Email: true
The SMA is great for representing a long-term activity, thus we recommend a 21-period duration representing a one-month forex trading day period.
The EMA is great for short-term movements, thus we recommend a 5-period duration representing a 5-day forex trading week.
SHI Channel Fast
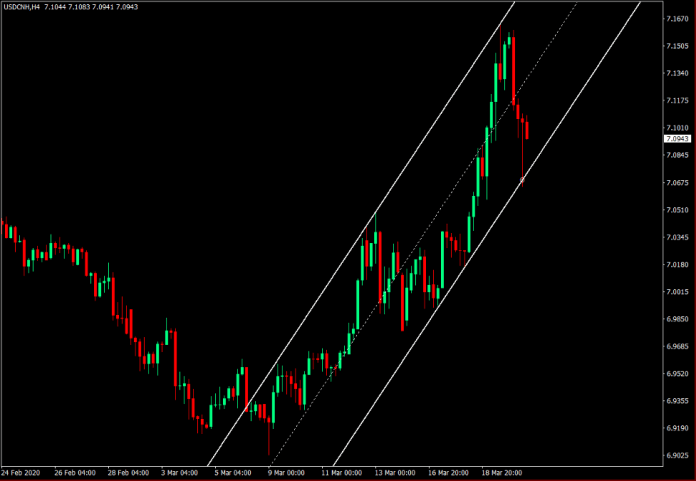
SHI Channel Fast is a trend-based technical indicator which automatically draws a trend line.
Trend lines are lines that connect a swing low to another swing low, and swing highs to another swing highs. These lines are mainly used to help traders predict where price might probably reverse as price tends to bounce off valid trend lines.
Beginner traders often find it difficult to identify a valid trend line. The SHI Channel Fast allows even beginner traders to identify trend lines and perform a market analysis based on it.
This indicator also identifies the trend lines regardless of whether the market is ranging or trending, allowing traders to profit in any market.
Advantages of SHI Channel Fast
- Trend lines are automatically plotted making it easier for traders to identify trend lines, identify the range of the market, and predict where price may reverse.
- It is applicable in any market condition, whether in an uptrend, downtrend or ranging market.
Disadvantages of SHI Channel Fast
- Losses may be incurred if price breaks through the trend line while a reversal entry setup is placed.
It is possible that price would break through the SHI Channel Fast trendline. As such, it is recommended to set rules that could help us avoid making rash decisions prior to entering a trade.
SHI Channel Fast Recommended Methods
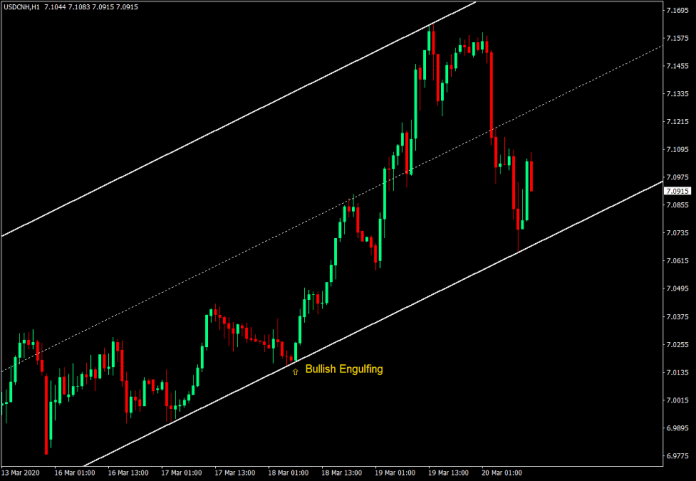
One of the best practices that traders may use when trading based on the SHI Channel Fast indicator is to consider price action and candlestick patterns as price touches the trend line. This includes patterns such as pin bars, engulfing patterns, and momentum candlesticks.
Buy Method
- Wait for price to touch the area near the bottom trend line.
- Enter a buy order as soon as you identify a bullish reversal candlestick pattern as price touches the bottom trend line.
Sell Method
- Wait for price to touch the area near the top trend line.
- Enter a sell order as soon as you identify a bearish reversal candlestick pattern as price touches the top trend line.
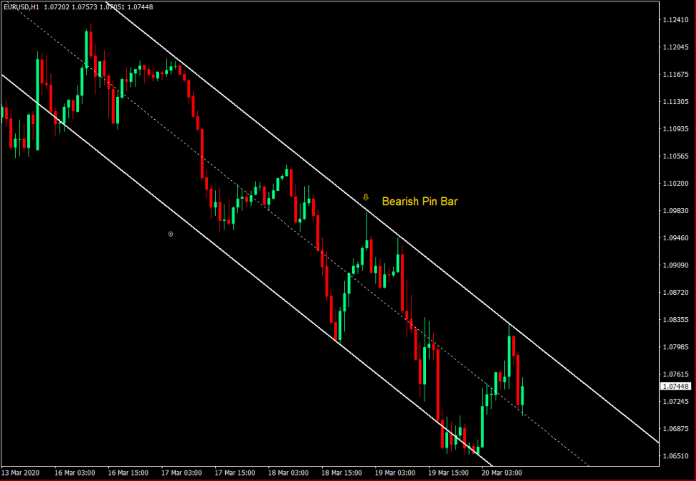
If the candlestick breaks through the trend line, it is likely that the market is reversing as price is beyond the predicted range. As such, it is necessary to close the trade and cut losses.
How to Set SHI Channel Fast
Recommended Setting Values: Default Setup
There is no need to change the settings on the SHI Channel Fast as the number of traders using varying values is very small. As such, it is recommended to keep the parameters at default settings.
Fibo Indicator
The Fibo indicator is based on the Fibonacci Retracement tool, which in turn is based on the Fibonacci sequence or ratio.
The Fibonacci sequence is a sequence of percentages or ratios which have been found to be recurring in nature. It was then coined to be the perfect ratio for patterns. It was also then theorized that the same percentages or ratios have been engrained in human psychology and most would find beauty in patterns with such ratios. Coincidentally, the same ratios or percentages of retracements have been discovered by many traders using technical analysis. It is observed that price does tend to respect the levels based on the Fibonacci ratios especially during deep retracements.
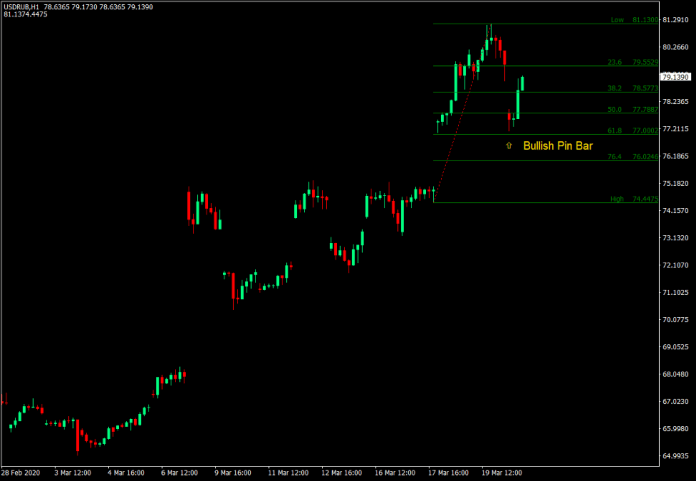
As such, the Fibonacci Retracement tool was developed. This tool allows traders to identify the retracement levels by connecting the most recent swing points and expect price to bounce off any of the identified Fibonacci Retracement levels. It plots multiple lines based on the Fibonacci ratio such as 23.6, 38.2, 50.0, 61.8 and more. Reversal candlesticks appearing near these lines can be a signal of a probable reversal.
Although the Fibonacci Retracement tool may be very effective, beginners might find it difficult to use as most beginners would find it difficult to properly identify the valid swing points.
The Fibo indicator makes it easier for new traders to identify such retracement areas as it automatically plots the retracement levels. This allows traders to effectively time reversals after retracements, without needing to identify the swing points and adjust the height of the Fibonacci retracement tool.
Advantages of Fibo
- It automatically adjusts the Fibonacci retracement line making it easier for beginners to trade using the Fibonacci method.
Disadvantages of Fibo
- Beginners might find it difficult to analyze market flow using Fibo alone.
As such, it is recommended to incorporate market analysis using price action and candlestick patterns rather than trading based on the Fibo retracement line exclusively.
Fibo Recommended Methods
The recommended method when trading using the Fibo indicator is to conduct market analysis based on the position and shape of the candlestick in relation to a Fibo retracement level.
First, find a currency pair with price action retracing deeply towards the Fibonacci retracement levels. Then, observe the candlestick as it nears these levels. You may trade in the direction of the trend if the candlestick indicates a possible price reversal pattern such as pin bars or engulfing patterns.
How to Setup Fibo
Recommended Settings: default settings
The default settings on this indicator have been found to be optimal. As such, it is recommended to use the default settings.
Stochastic Oscillator
The Stochastic Oscillator is one of the most popular oscillator types of technical indicator which is mainly used to help traders visualize and identify overbought and oversold price conditions.
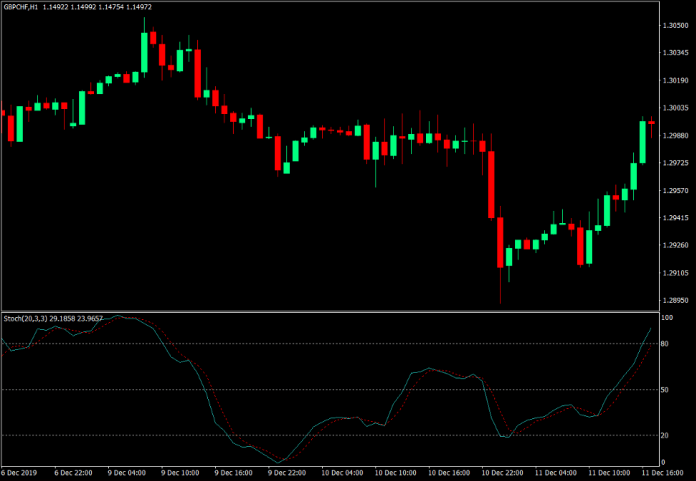
This indicator plots two lines, %K and %D, that oscillate within the range of zero to 100. Momentum direction is mainly identified based on how the two lines overlap. As such, crossovers between the two oscillating lines indicate a potential short-term momentum or trend reversal.
It also has markers at level 20 and 80. Oscillator lines that are below 20 indicate an oversold market condition, while oscillator lines that are above 80 indicate an overbought market condition.
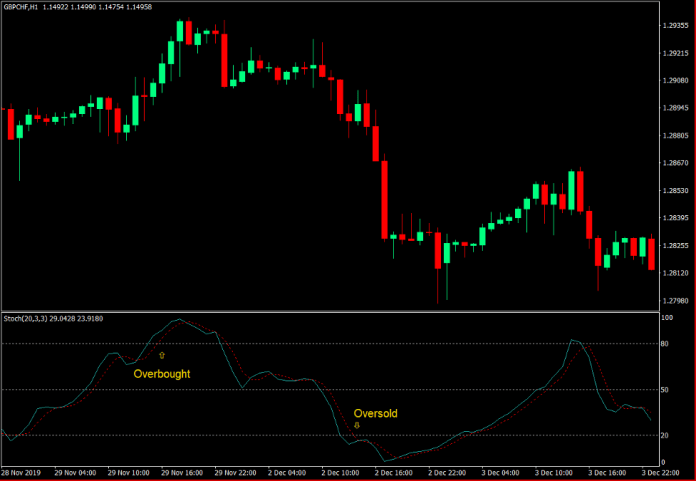
Compared to most trend following and momentum indicators, the Stochastic Oscillator responds quickly to price changes making it more suitable for trading short-term trend and momentum reversals.
Advantages and Disadvantages of the Stochastic Oscillator
The Stochastic Oscillator has advantages and disadvantages which traders should also know before using them. The following are the advantages and disadvantages of the Stochastic Oscillator.
Advantages of the Stochastic Oscillator
- It can be effective for trading short-term trade setups because it responds quickly to price movements which in turn makes it quick to produce short-term trend or momentum reversal signals.
- The Stochastic Oscillator is applicable for both buy and sell trade setups because it can detect both oversold and overbought price conditions and indicate potential bullish and bearish momentum reversals.
Disadvantages of the Stochastic Oscillator
- False signals may be generated more often if a strong trend causes the Stochastic Oscillator to produce a lot of overbought or oversold market conditions with false momentum reversal signals.
Stochastic Oscillator Tips
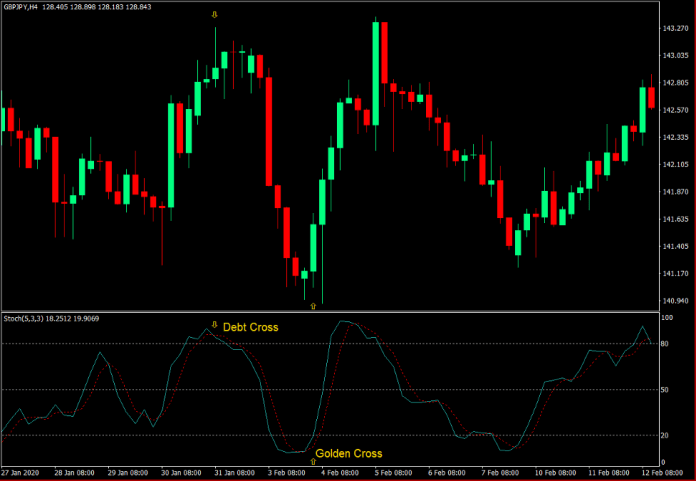
The Stochastic Oscillator produces high probability mean reversal trade setups whenever the Stochastic Oscillator lines create a golden cross while below 20% (oversold) or debt cross while above 80% (overbought).
Golden Cross
- Both Stochastic Oscillator lines should drop below 20%.
- The Stochastic Oscillator line representing the short-term momentum should cross above the Stochastic Oscillator line representing the long-term momentum from bottom to top.
Debt Cross
- Both Stochastic Oscillator lines should breach above 80%.
- The Stochastic Oscillator line representing the short-term momentum should cross below the Stochastic Oscillator line representing the long-term momentum from top to bottom.
Recommended Stochastic Oscillator Setup
The recommended Stochastic Oscillator Setup is as follows:
- %K period: 5
- %D period: 3
- Moving Average Type: Simple
Most short-term trend and momentum reversal traders who use the Stochastic Oscillator generally uses the 5 and 3-period setup for the %K period and %D period respectively. As such, it is recommended that we use the same setup.
However, we may also modify the %K period and adjust it higher if we would want to make the Stochastic Oscillator indicator smoother. This would generate lesser false signals but the indicator’s response time in producing momentum reversal signals would be a bit more lagging.
Relative Strength Index
RSI is an abbreviation which stands for Relative Strength Index. It is a one of the most widely used oscillator type of technical indicator which is built-in with the MT4 platform that could be readily used by traders.
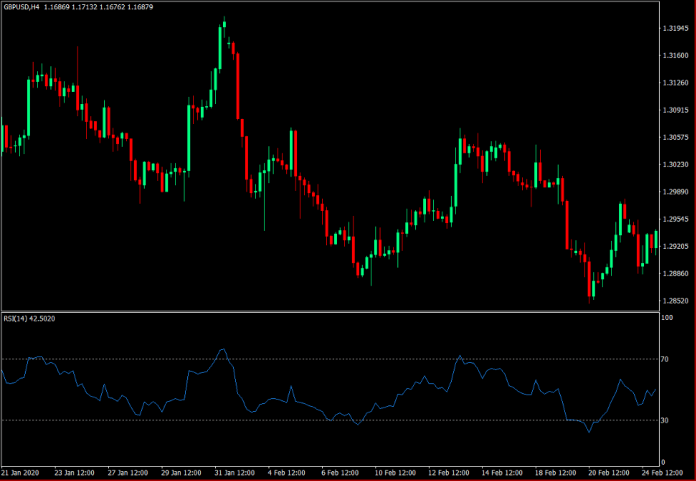
The RSI plots a line graph which oscillates within the range of 0 to 100 and is mainly used by traders to help them visualize and identify oversold and overbought market conditions.
RSI Formula
The underlying formula which plots the RSI line is as follows:
RSI = (Total increase in a certain period) / (Total increase in a certain period + Decrease in a certain period) x 100%
This computation indicates the ratio of the degree to which price rose and dropped within a certain period, relative to its total movement range. If for example, price rose by a ratio of 8 out of 10, wherein 8 is the rise in price, while 10 is the total increase and decrease movement, the RSI line will be plotted as 80%.
Since the RSI is generally used as an overbought and oversold mean reversal indicator, the RSI indicator is preset to include a marker at level 30 and 70. These markers represent the oversold and overbought levels. The market is considered oversold whenever the RSI line is below 30 and overbought whenever the RSI line is above 70. Reversals occurring at these levels tend to be a high probability mean reversal signal.
Many traders also add levels 45, 50 and 55 as markers. These levels can be used as an additional trend direction indicator.
Level 50 can be used as a general trend directional bias level. The trend bias is considered bullish whenever the RSI line is above 50 and bearish whenever it is below 50.
The levels 45 and 55 can be used both as a support and resistance levels for RSI in relation to a trending market, and as a confirmation to a trend reversal in cases wherein the RSI line breaches these levels.
In a bullish trending market condition, the market would tend to respect level 45 as a support level for the RSI line.
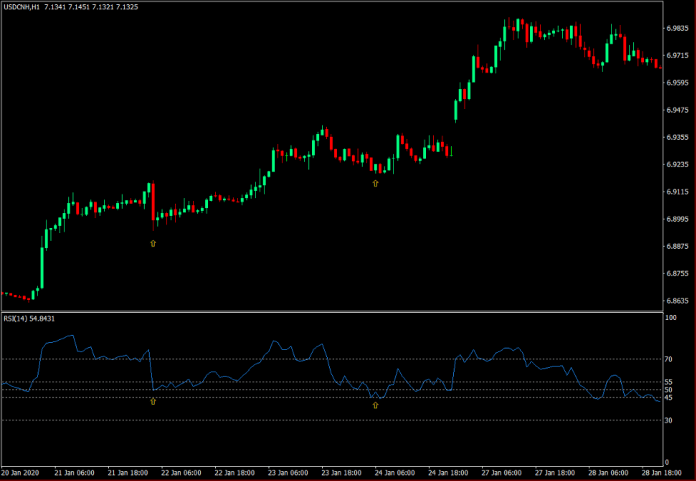
On the other hand, the market would tend to respect the level 55 as a resistance level for the RSI line in a bearish trending market condition.
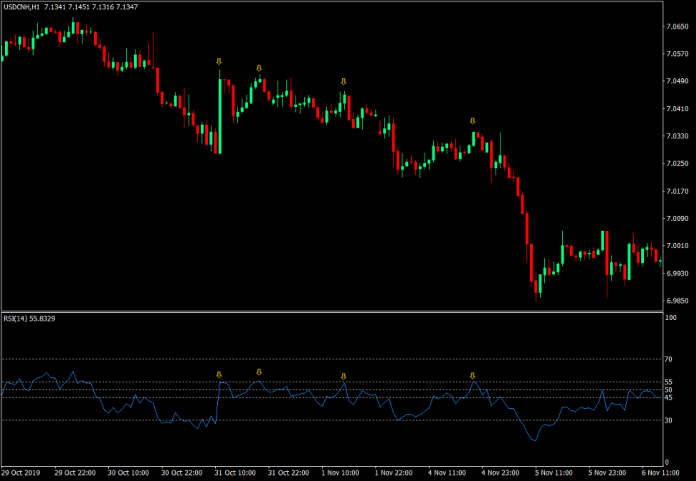
As such, the RSI line can also be used to identify divergences, which are discrepancies between the intensity of price swing of price action on the price chart compared to the intensity of the peaks and troughs of the RSI line on its own indicator window.
Inversely, the same levels 45 and 55 can be used to indicate a trend reversal.
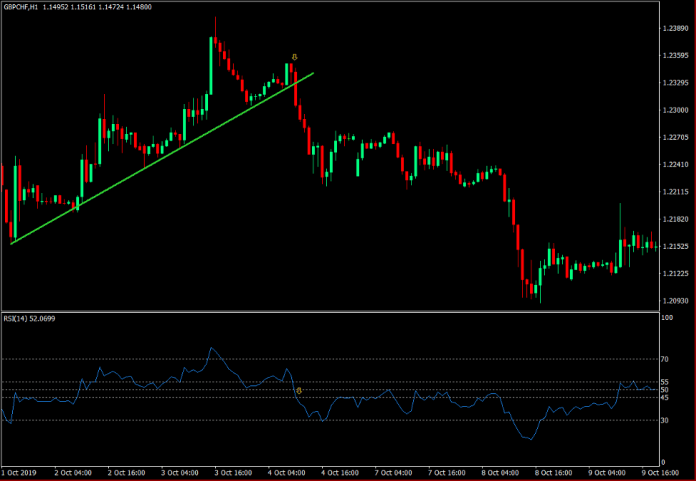
Breaches above 55 by the RSI line, which is in confluence with a bullish price action characteristic or a bullish breakout, can confirm a bullish trend reversal. The chart below shows us a bullish breakout with a bullish pin bar, which are in confluence with a breach above 55 by the RSI line.
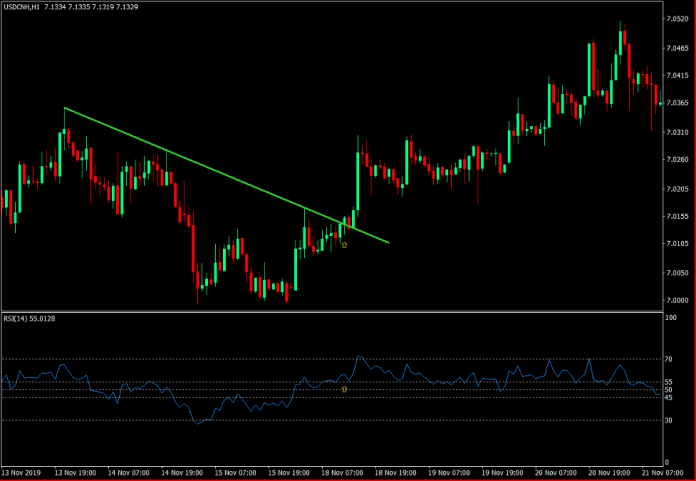
Inversely, drops below 45 by the RSI line, which is also in confluence with a bearish price action characteristic or a bearish breakout, would also confirm a bearish trend reversal. This chart shows us a bearish support line breakdown and a bearish momentum candle, which is in confluence with the RSI line dropping below 45.
RSI Advantages and Disadvantages
The RSI indicator is a widely used technical indicator, one of the most popular among the oscillator type of indicators. However, as with most technical indicators, the RSI also has its own advantages and disadvantages.
Advantages of the RSI
- It is very effective for analyzing overbought and oversold market conditions.
- It is very versatile and can be used to identify and confirm trends and trend reversals.
Disadvantages of the RSI
- False trend or mean reversal signals may be generated whenever the market is trending strongly in a certain direction.
The RSI indicator is very useful for identifying overbought and oversold market conditions, which are often high probability mean reversal trade setups. However, the same mean reversal setups may not be a good mean reversal setup whenever there is a strong market trend. As such, it is best to modify how we view the market using the RSI as a trend confirmation indicator rather than a mean reversal indicator. In other words, we should adapt how we use the RSI indicator depending on the type of market we are in.
RSI Recommendations
The most popular method when using the RSI is as an oversold or oversold mean reversal indicator. This is often identified by an RSI line reversing after it breaches level 30 or 70. Some traders use levels 20 and 80 to avoid false signals and trade higher probability mean reversal setups only.
In this setup, we are using an RSI line reversing from levels 70 and 30, while in conjunction with price action showing signs of reversal as it pushes against the outer Bollinger Band dynamic support and resistance lines.
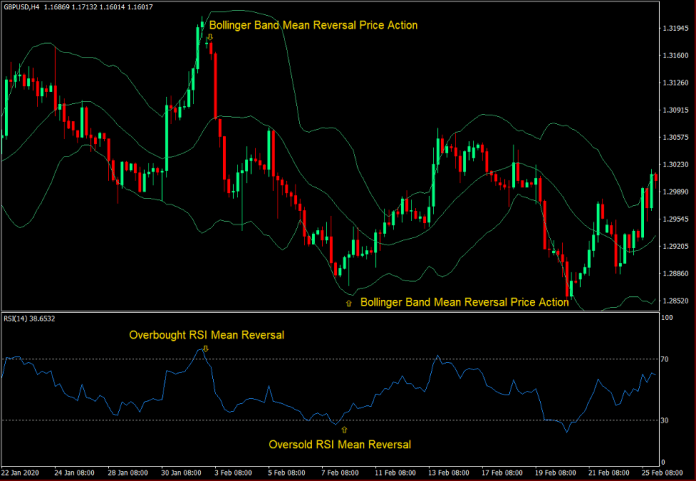
Buy Setup Using Bollinger Bands and the RSI
- Price action should show characteristics of pushing against the lower Bollinger Band.
- The RSI line should cross back above 30 after dropping below it.
Sell Setup Using Bollinger Bands and the RSI
- Price action should show characteristics of pushing against the upper Bollinger Band.
- The RSI line should cross back below 70 after breaching above it.
How to Set the RSI
The most widely used period setup for the RSI is at 14 periods. However, traders may adjust it depending on their trade horizon.
Short-term Momentum Trading: 9, 14, and 22 periods
Mid-term Trading: 42 and 52
Long-term Trading: 63 and 91
Conclusion: Find the Indicator That Works Best for You
In this article, we have discussed several technical indicators which are very popular and are widely used among traders. We have discussed the concepts behind each indicator, its advantages and disadvantages, as well as the most popular methods in which they are used.
However, as mentioned each indicator has its own advantages and disadvantages. Each indicator works well for certain types of market. Each indicator works well for a particular style of trading.
As such, it is best that you find the best indicator which suits your trading style and methods. Test each indicator. Mix and match them and explore the method that works best for you.
MT4 Indicators – Download Instructions
5 MT4 Indicators That Can Improve Your Trading Win Rate is a Metatrader 4 (MT4) indicator and the essence of this technical indicator is to transform the accumulated history data.
5 MT4 Indicators That Can Improve Your Trading Win Rate provides for an opportunity to detect various peculiarities and patterns in price dynamics which are invisible to the naked eye.
Based on this information, traders can assume further price movement and adjust their strategy accordingly. Click here for MT4 Strategies
Recommended Forex MetaTrader 4 Trading Platform
- Free $50 To Start Trading Instantly! (Withdrawable Profit)
- Deposit Bonus up to $5,000
- Unlimited Loyalty Program
- Award Winning Forex Broker
- Additional Exclusive Bonuses Throughout The Year

>> Claim Your $50 Bonus Here <<
Click Here for Step-By-Step XM Broker Account Opening Guide
How to install 5 MT4 Indicators That Can Improve Your Trading Win Rate.mq4?
- Download 5 MT4 Indicators That Can Improve Your Trading Win Rate.mq4
- Copy 5 MT4 Indicators That Can Improve Your Trading Win Rate.mq4 to your Metatrader Directory / experts / indicators /
- Start or restart your Metatrader 4 Client
- Select Chart and Timeframe where you want to test your MT4 indicators
- Search “Custom Indicators” in your Navigator mostly left in your Metatrader 4 Client
- Right click on 5 MT4 Indicators That Can Improve Your Trading Win Rate.mq4
- Attach to a chart
- Modify settings or press ok
- Indicator 5 MT4 Indicators That Can Improve Your Trading Win Rate.mq4 is available on your Chart
How to remove 5 MT4 Indicators That Can Improve Your Trading Win Rate.mq4 from your Metatrader Chart?
- Select the Chart where is the Indicator running in your Metatrader 4 Client
- Right click into the Chart
- “Indicators list”
- Select the Indicator and delete
5 MT4 Indicators That Can Improve Your Trading Win Rate (Free Download)
Click here below to download:
Download Now
 آموزش مجازی مدیریت عالی حرفه ای کسب و کار Post DBA آموزش مجازی مدیریت عالی حرفه ای کسب و کار Post DBA+ مدرک معتبر قابل ترجمه رسمی با مهر دادگستری و وزارت امور خارجه |  آموزش مجازی مدیریت عالی و حرفه ای کسب و کار DBA آموزش مجازی مدیریت عالی و حرفه ای کسب و کار DBA+ مدرک معتبر قابل ترجمه رسمی با مهر دادگستری و وزارت امور خارجه |  آموزش مجازی مدیریت کسب و کار MBA آموزش مجازی مدیریت کسب و کار MBA+ مدرک معتبر قابل ترجمه رسمی با مهر دادگستری و وزارت امور خارجه |
 مدیریت حرفه ای کافی شاپ |  حقوقدان خبره |  سرآشپز حرفه ای |
 آموزش مجازی تعمیرات موبایل آموزش مجازی تعمیرات موبایل |  آموزش مجازی ICDL مهارت های رایانه کار درجه یک و دو |  آموزش مجازی کارشناس معاملات املاک_ مشاور املاک آموزش مجازی کارشناس معاملات املاک_ مشاور املاک |
- نظرات ارسال شده توسط شما، پس از تایید توسط مدیران سایت منتشر خواهد شد.
- نظراتی که حاوی تهمت یا افترا باشد منتشر نخواهد شد.
- نظراتی که به غیر از زبان فارسی یا غیر مرتبط با خبر باشد منتشر نخواهد شد.


ارسال نظر شما
مجموع نظرات : 0 در انتظار بررسی : 0 انتشار یافته : ۰